


ラマンテクニック:基礎とフロンティア
要約
ラマン分光法は、化学センシング、生物学的イメージング、および材料特性評価のアプリケーションによって推進されており、さまざまな科学分野からますます関心を集めています。ラマン効果は、光の非弾性散乱に起因し、分子や材料の振動/回転振動状態を直接調べることができます。赤外分光法に勝る多くの利点にもかかわらず、自発的ラマン散乱は非常に弱く、その結果、さまざまな強化されたラマン分光法が出現しました。これらの技術には、誘導ラマン散乱とコヒーレント反ストークスラマン散乱、および表面および先端が強化されたラマン散乱分光法が含まれます。現在のレビューは、ラマン効果とその利点、制限、およびアプリケーションを支配する基本的な物理学の理解を読者に提供します。レビューはまた、主要な実験的ラマン分光技術を実装するための重要な実験的考慮事項を強調しています。関連するデータ分析方法とラマン効果に関連する最新の進歩のいくつかが最後に提示されます。このレビューは、ラマン分光法の科学への実用的な紹介を構成します。また、将来の研究開発の最近の有望な方向性にも焦点を当てています。
はじめに
ラマン分光法
光と物質の相互作用にはさまざまな形態があります。蛍光とリン光は、物質による光の吸収とその後の放出の例です。原子、分子、フォノンによるレイリー散乱やダスト粒子によるミー/チンダル散乱などの光の弾性散乱は、光の波長が変わらない例です。結晶中の音波によるブリルアン散乱、荷電粒子によるコンプトン散乱、分子やフォノンによるラマン散乱などの非弾性散乱は、光の波長が変化する例です[1]。分子による光のラマン散乱は、1923年にSmekalによる古典的な量子論を使用して最初に予測され[2]、1928年にRamanとKrishnanによって実験的に観察されました[3、4]。
現在、自発ラマン、ハイパーラマン散乱、フーリエ変換ラマン散乱[5]、ラマン誘起カー効果分光法[6]、刺激/コヒーレントラマン散乱[1]など、25種類以上の既知のラマン分光法があります。 。このレビューでは、自発的および刺激ラマン散乱、コヒーレント反ストークスラマン散乱(CARS)、表面増強ラマン散乱(SERS)、および先端増強ラマン散乱(TERS)について検討します。
最初の観察から50年後、ラマン分光法は、赤外光の吸収を伴うものなど、他の光学計測技術の中でも卓越した分析技術になり始めました。特に水やその他の有用な極性溶媒が存在する場合、これらの媒体は通常、赤外領域の光を強く吸収するためです。たとえば、1974年に、Fleischmann etal。 [7]は、ラマン分光法を使用して、銀電極の表面に吸着した2種類のピリジン(基本的な環状ヘテロダイン化合物分子)を区別し、吸収効果を軽減しました。ちなみに、この実験はSERSの最初の偶然の観察でした。
ラマン分光法は現在、2D材料の特性評価のための優れた技術です(例:。 グラフェン[8,9,10]および遷移金属ジカルコゲナイド[11,12,13])および結晶中のフォノンモード[14,15,16]。単分子層の数[9、12、17、18]、層間呼吸およびせん断モード[19]、面内異方性[20]、ドーピング[21,22,23]、無秩序[10、24、 25,26]、熱伝導率[11]、ひずみ[27]、フォノンモード[14、16、28]は、ラマン分光法を使用して抽出できます。
生物学的および医学的研究分野は、ラマン分光法の開発によって大きな影響を受けます。ラマン分光法は、ラベルフリー(蛍光マーカー分子を必要としない[29、30])の化学的に選択的なハイパースペクトルイメージング技術です[31]。例えば、皮膚への薬物の経皮送達を研究することは、しばしばエクスビボおよび侵襲的分析技術を命じる。皮膚の再生が停止し、免疫応答が停止し、代謝活性が通常失われるため、exvivoでの経皮送達研究は好ましくありません。したがって、エクスビボでの経皮薬物送達の性能は、インビボの状況を正確に反映していない[32]。ただし、ラマン分光法を使用して非侵襲的な生体内測定を実行し、皮膚の分子組成と濃度勾配に関する詳細な情報を取得することができます[33]。多くの生物学的プロセスでは、バクテリアなどの生きている微生物が生体触媒として機能します。ラマン分光法は、生体触媒プロセスにおける個々の細胞の特性と生理学的状態の不均一性を調べることができます[34]。ラマン分光法は、良性および悪性の乳がん病変を特定し、それらの固有の化学組成を調べることによって区別するためにも使用されています[35]。
生物学的サンプルの場合、ピークの約90%が「指紋」スペクトル領域にあり、(\(\ Delta \ overset {\ sim} {\ nu} \)〜500 cm -1 をカバーしています。 〜1800 cm -1 ; \(\ Delta \ overset {\ sim} {\ nu} \)は、「解析方法」セクションで定義された波数シフトです)、残りは、(\(\ Delta \ overset {\ sim} {\ nu} \)〜2700 cm -1 〜3300 cm -1 )[36]。
コヒーレントラマン分光法
散乱物質と同時に相互作用する複数の入射光子を含むコヒーレント光散乱イベントは、1930年代に予測が行われたにもかかわらず、1960年代にレーザー光源が利用可能になるまで観察されませんでした[37、38]。最初のレーザーベースのラマン散乱実験は1961年に実証されました[39]。誘導ラマン散乱(SRS)とCARSは、著名な4光波混合技術になり、このレビューで興味深いものになっています。
SRSはコヒーレントプロセスであり、自発ラマン分光法に比べてはるかに強力な信号と、振動運動を時間分解する機能を提供します。 SRSは、プラズマ物理学[40]、原子干渉計[41]、スーパーコンティニウム生成[42]、食品中の生体分子のイメージング[43]、生細胞内のイメージング化学[44]、バルクメディア、ナノスケールの標本[45]。プラズマ中のSRSによる光子軌道角運動量の交換は、特に慣性閉じ込め研究の文脈で関心を集めています[40、46、47、48]。スーパーコンティニウムの生成は、非線形材料を通過する強い光パルスの劇的なスペクトルの広がりを特徴とする複雑な非線形現象です[49]。ナイト他[42]は、SRSによるフラットな超広帯域オクターブスパン白色光スーパーコンティニウム生成と、フォトニック結晶ファイバでのサブキロワットピークパワーの60psポンプパルスによるパラメトリック4光波混合を実証しました。 KasevichとChu [41]は、刺激されたラマン遷移の機械的効果を使用して、レーザー冷却されたナトリウム原子を備えた物質波干渉計を実証しました。 SRSは、視覚色素ロドプシンにおけるレチナールの一次異性化の時間分解振動スペクトルを観察するためにも使用されています[50]。
1999年の復活以来、CARSは生物医学における卓越した振動モードイメージングツールになりました[51、52]。反ストークス光子はポンプとストークス周波数から赤方偏移するため、単一光子蛍光の存在下でより簡単に検出されます[53]。 CARS顕微鏡は、生細胞イメージング[51、54]、骨格幹細胞[55]、生体組織中の有毒ナノ物質の追跡[56]、ヒト体細胞分裂の体積イメージング[57]、フローサイトメトリー[58、 59]、脳腫瘍の検出[60]および生細胞におけるオルガネラ輸送の追跡[61]。 Zirak etal。 [62]は、in vivoイメージング用のCARS内視鏡を開発し、マウスの脂肪組織とヒトの腓腹神経サンプルを使用して機器を実証しました。 Evans etal。 [63]は、CARSとビデオレート顕微鏡を組み合わせて、生体内で組織を化学的に画像化しました。 PotmaとXie [64]は、CARSを使用して単一脂質二重層の脂質相分離を直接視覚化しました。 CARSは、高時間および空間分解能のサーモグラフィ技術としても使用でき、電子および光電子デバイスの特性評価[65]、さらにはターボ機械[66]にも応用されています。
配向秩序は、多くのソフトマターシステムの顕著な特徴です。構造分子組織の詳細は、生物学、生物医学、材料科学、分子物理学の分野での一般的な目標です[67]。偏光分解光学顕微鏡は、顕微鏡の焦点ボリュームへの分子配向分布に対処するための強力なツールになりつつあります[68]。コヒーレント非線形光学では、分極した第二高調波発生[69,70,71]、分極した第三高調波発生[72]、および分極した4光波混合[73、74]が、生体内の内因性タンパク質および脂質に関する配向情報を回復するためにすでに使用されています。組織。配向情報に加えて、コヒーレントラマン散乱(CRS)プロセスは分子結合の振動に敏感であり、蛍光標識/色素を必要とせずに化学的特異性を可能にします[75,76,77]。 CARS顕微鏡は、液晶(ディスプレイ技術で一般的に使用される)サンプルの化学的および配向的秩序を画像化するために使用できます[78]。偏光分解ハイパースペクトルSRS顕微鏡は、歯を使ったラベルフリーの生体分子イメージング技術としても実証されています[79]。さらに、分極化CARSは、マウスのサブ回折スケールでミエリンの脂質の分子秩序を研究するために使用されています[80]。
拡張ラマン分光法
ラマン分光法の感度は、共鳴ラマン分光法[81]、TERS [82、83]、SERS [84]などのさまざまな手法で向上させることができます。 SERSは、分析物材料が配置される表面を変更することにより、ラマン信号の数桁の増強を可能にするため、特に興味深いものです。 TERSとSERSの強化された光と物質の相互作用は、誘電体表面上の金属膜の表面ナノ構造を変更することによって(ある程度)調整可能です[85、86]。プラズモンとして知られる電荷密度振動の波長は、これらの表面ナノ構造に依存しており、局所的に光と物質の相互作用を高めることができます[87]。プラズモンは物理学の重要なトピックであり、フィルター[88]、導波路[88、89]、偏光子[90]、ナノスケール光源[91]などのプラズモンデバイスが現在実現されています。
フライシュマン等。 [7]は、1974年に銀電極の粗い表面でピリジンを調べたときに最初にSERSを観察しました[92]。 SERSの感度は、電気触媒作用、太陽エネルギー変換、電池のエネルギー貯蔵、光合成などの生物学的イベントなど、多くの基本的なプロセスの中心にある電子移動反応の研究に最適です[93]。 SERSは、爆発物/化学兵器[94]、未修飾DNA [95]、エアロゾル汚染物質[96]および病原体[97]を検出するための貴重な技術としても特定されています。
TERSは、ナノメートルスケールの空間分解能でスペクトル情報を提供する手法です[98]。 TERSの最初の報告が2000年に発表されて以来[99、100]、TERSは薄い結晶性材料[101]、カーボンナノチューブ[86、102、103]、RNA / DNAの一本鎖[104、105]を研究するための強力な技術になりました。 ]、レドックス反応[106]、個々の分子のマッピング[83]、半導体ナノ構造およびマイクロキャビティ[107]。
次のセクションでは、自発的ラマン効果、刺激およびコヒーレントラマン分光法、SERSおよびTERSを支える基本的な物理学について、それらのアプリケーションのコンテキストで詳しく説明します。実験的考察が議論され、ラマン分光装置のセットアップの例が提示されます。スペクトルを表示するための規則が詳細に説明されており、ラマン分光法の各アプリケーションの分析手法の例が示されています。最後のセクションでは、ラマン分光法の現在のフロンティアを構成する最近の進歩が、世界中のさまざまな研究分野から提示されています。
基本原則
光が物質と相互作用すると、光の振動電磁(EM)場が物質の電荷分布を乱し、エネルギーと運動量の交換を引き起こして、物質を修正された状態のままにします。例としては、液体と気体の電子励起と分子振動または回転振動(回転振動)、固体の電子励起と光フォノン、プラズマの電子プラズマ振動などがあります[108]。
自発的ラマン
入射光子が結晶格子または分子と相互作用すると、弾性的または非弾性的に散乱する可能性があります。主に、光は弾性的に散乱されます(つまり、。 散乱光子のエネルギーは、入射光子のエネルギーと同じです)。このタイプの散乱は、レイリー散乱と呼ばれることがよくあります。 。物質による光の非弾性散乱(つまり、。 散乱光子のエネルギーは入射光子のエネルギーと等しくありません)は、ラマン効果として知られています。 [1、4、6]。この非弾性プロセスにより、分子は変更された(回転)振動状態になります。結晶格子の場合、エネルギー移動により、フォノンと呼ばれる格子内に振動の量子が生成されます。 (準粒子)。結晶内のラマン散乱は、常磁性イオン、表面プラズモン(このレビューの後半で説明します)、およびスピン波を引き起こす可能性もあります[15]。散乱光の角周波数のシフトは、次の式で表すことができます。
$$ {\ omega} _ {\ mathrm {scat}} ={\ omega} _ {\ mathrm {p}} \ pm {\ omega} _ {\ mathrm {osc}}、$$(1)下付き文字oscは格子または分子の振動を示し、pは入射光子(ポンプ光子と呼ばれることが多い)を示します。 )およびscatは散乱光を示します[1]。二項演算子(±)は、エネルギー節約によって決定されます。散乱光子のエネルギーが入射光子のエネルギーよりも低い場合(つまり、。 赤方偏移)、このプロセスはストークスラマン散乱と呼ばれます 。逆に、散乱光子のエネルギーが入射光子のエネルギーよりも高い場合(つまり、。 青方偏移)、このプロセスはアンチストークスラマン散乱と呼ばれます。 。ラマンプロセスは、波数ベクトル形式で次のように表される運動量も保存する必要があります。
$$ {\ overset {\ rightharpoonup} {k}} _ {\ mathrm {scat}} ={\ overset {\ rightharpoonup} {k}} _ {\ mathrm {p}} \ pm \ overset {\ rightharpoonup} { q}、$$(2)ここで、\({\ overset {\ rightharpoonup} {k}} _ {\ mathrm {scat}} \)、\({\ overset {\ rightharpoonup} {k}} _ {\ mathrm {p}} \)および\ (\ overset {\ rightharpoonup} {q} \)は、それぞれ散乱光、入射光、フォノンまたは分子(ro-)振動の波数ベクトルです。
分子や結晶では、電荷分布は平衡状態になりがちです。外部から印加された場は、電荷分布を変更または混乱させる可能性がありますが、異方性の可能性がある双極子を形成する分子または結晶の能力に応じてのみです。分子と結晶のこの異方性特性は、それぞれ分極率と誘電感受率と呼ばれます。古典的なアプローチでは、ラマン効果の存在は、原子間変位の振動性により、分極率(分子(ro-)振動の場合)または誘電感受率(結晶格子振動の場合)の変調に関連していると理論付けられています[6、109 ]。結晶格子振動の場合、材料の分極ベクトル\(\ overset {\ rightharpoonup} {P} \)を考慮してください。接尾辞 j の場合 および k x のベクトル成分を表す 、 y および z 方向、 j th \(\ overset {\ rightharpoonup} {P} \)のコンポーネント(一次 )は、[110]によって光に関連付けられた振動電場ベクトル\(\ overset {\ rightharpoonup} {E} \)に関連しています:
$$ {P} _j ^ {(1)} ={\ varepsilon} _0 {\ chi} _ {jk} ^ {(1)} {E} _k、$$(3)ここで、ε 0 は自由空間の誘電率、χ jk は材料の誘電感受率(ランク2のテンソル)であり、繰り返されるインデックスの合計の規則が暗示されています[109]。上付き文字(1)は、これが分極への一次寄与であることを示します[1]。分極率テンソルは核座標の関数であり、拡張すると、(ro-)振動周波数にも依存することを意味します。変調が小さいと仮定すると、振動の座標に関する依存性はテイラー級数で次のように表すことができます。
$$ {\ chi} _ {jk} ^ {(1)} \ left({\ overset {\ rightharpoonup} {k}} _ {\ mathrm {p}}、{\ omega} _ {\ mathrm {p} } \ right)\ approx {\ chi} _ {jk} ^ {(1)} {\ left({\ overset {\ rightharpoonup} {k}} _ {\ mathrm {p}}、{\ omega} _ { \ mathrm {p}} \ right)} _ {\ overset {\ rightharpoonup} {u} =0} + {u} _l {\ left(\ frac {\ partial {\ chi} _ {jk} ^ {(1 )} \ left({\ overset {\ rightharpoonup} {k}} _ {\ mathrm {p}}、{\ omega} _ {\ mathrm {p}} \ right)} {\ partial {u} _l} \右)} _ {\ overset {\ rightharpoonup} {u} =0} + {u} _l {u} _m {\ left(\ frac {\ partial ^ 2 {\ chi} _ {jk} ^ {(1) } \ left({\ overset {\ rightharpoonup} {k}} _ {\ mathrm {p}}、{\ omega} _ {\ mathrm {p}} \ right)} {\ partial {u} _l \ partial { u} _m} \ right)} _ {\ overset {\ rightharpoonup} {u} =0} + \ dots、$$(4)ここで、\(\ overset {\ rightharpoonup} {u} \)は核変位ベクトルであり、インデックス j 、 k 、 l および m そのインデックスの構成要素の合計を意味する用語のいずれかで繰り返されるインデックスを使用して、異なる空間座標を示します。光に関連する電界を次のように書くと:
$$ \ overset {\ rightharpoonup} {E} \ left(\ overset {\ rightharpoonup} {r}、t \ right)=\ overset {\ rightharpoonup} {E} \ left({\ overset {\ rightharpoonup} {k }} _ {\ mathrm {p}}、{\ omega} _ {\ mathrm {p}} \ right)\ cos \ left({\ overset {\ rightharpoonup} {k}} _ {\ mathrm {p}} \ bullet \ overset {\ rightharpoonup} {r}-{\ omega} _ {\ mathrm {p}} t \ right)、$$(5)そして核の変位は次のとおりです:
$$ \ overset {\ rightharpoonup} {u} \ left(\ overset {\ rightharpoonup} {r}、t \ right)=\ overset {\ rightharpoonup} {u} \ left(\ overset {\ rightharpoonup} {q} 、{\ omega} _ {\ mathrm {osc}} \ right)\ cos \ left(\ overset {\ rightharpoonup} {q} \ bullet \ overset {\ rightharpoonup} {r}-{\ omega} _ {\ mathrm {osc}} t \ right)、$$(6)\({P} _j ^ {(1)} \)の時間依存性の明示的な式は、単色光と変位のこれら2つの数式を代入することで見つけることができます。結果として得られる多数の用語は、レイリー散乱、光学吸収、ラマン散乱などの光学プロセスに関係します。一次ラマン散乱に関係する項は、式(1)の右辺の第2項から導き出されます。 4と歩留まり:
$$ {P} _j \ left(\ overset {\ rightharpoonup} {r}、t、\ overset {\ rightharpoonup} {u} \ right)=\ frac {1} {2} {\ varepsilon} _0 {\ left (\ frac {\ partial {\ chi} _ {jk} ^ {(1)} \ left({\ overset {\ rightharpoonup} {k}} _ {\ mathrm {p}}、{\ omega} _ {\ mathrm {p}} \ right)} {\ partial {u} _l} \ right)} _ {\ overset {\ rightharpoonup} {u} =0} {u} _l \ left(\ overset {\ rightharpoonup} {q }、{\ omega} _ {\ mathrm {osc}} \ right){E} _k \ left({\ overset {\ rightharpoonup} {k}} _ {\ mathrm {p}}、{\ omega} _ { \ mathrm {p}} \ right)\ times \ left \ {\ cos \ left [\ left({\ overset {\ rightharpoonup} {k}} _ {\ mathrm {p}} + \ overset {\ rightharpoonup} { q} \ right)\ bullet \ overset {\ rightharpoonup} {r}-\ left({\ omega} _ {\ mathrm {p}} + {\ omega} _ {\ mathrm {osc}} \ right)t \ right] \ bullet + \ cos \ left [\ left({\ overset {\ rightharpoonup} {k}} _ {\ mathrm {p}}-\ overset {\ rightharpoonup} {q} \ right)\ bullet \ overset { \ rightharpoonup} {r}-\ left({\ omega} _ {\ mathrm {p}}-{\ omega} _ {\ mathrm {osc}} \ right)t \ right] \ right \} $$(7 )。この項には、合計(反ストークス)周波数と差(ストークス)周波数が含まれ、式(1)に従って運動量の保存を示します。この定式化は、参考文献からの古典的な説明に従います。 [1、109]。
ラマン過程の量子力学的記述は、分子/フォノンの(回転)振動エネルギーが離散量子であると述べています。図1aは、ωでストークス放出を伴うラマンプロセスを示すエネルギー準位図を示しています。 S ωでの反ストークス放出 AS 。
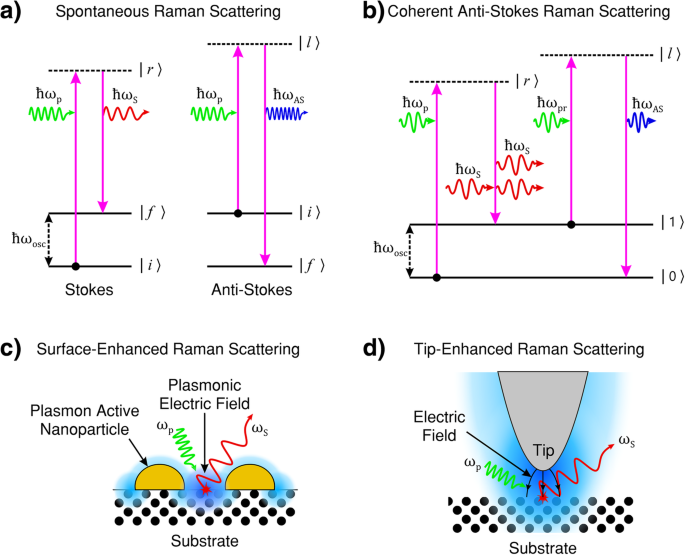
a ストークス(左)および反ストークス(右)ラマン散乱のエネルギー移動プロセス。両方の散乱プロセスで、励起状態の寿命は確率的で自発的です。ストークスラマン散乱では、初期(回転)振動エネルギー | i〉 散乱物質のは最終状態のそれよりも少ない | f〉 、散乱光はポンプ光よりもエネルギーが少ない。反ストークス散乱では、初期(回転)振動エネルギー | i〉 散乱媒体のそれは最終状態のそれよりも大きい | f〉 、散乱光はポンプ光よりも多くのエネルギーを持っています。 b コヒーレント反ストークスラマン散乱(CARS)。 CARSは、ポンプ、ストークス、プローブ、およびアンチストークス光の4光波混合プロセスであり、中間(ro-)振動エネルギー状態の反転分布によってアンチストークス光の放出がコヒーレントに誘導されます。 c 表面増強ラマン散乱(SERS)。入射ポンプ光は表面プラズモン共鳴を誘発します。結果として生じる表面の振動電磁(EM)磁場強度(青で表示)の強化は、光と物質の相互作用を強化し、その結果、ラマン散乱光の強度を増加させます。 d 先端増強ラマン散乱(TERS)。入射ポンプ光は、プラズモン的に活性なチップに関連するチップ表面プラズモン共鳴を誘発します。結果として生じる振動電磁場強度の向上(青で表示)は、先端の頂点の近くに局在します。避雷針効果(曲線の黒い矢印で示されている)は、先端領域での光と物質の相互作用を強化し、高解像度(光の回折限界を超える)のラマンイメージングを提供します。 a 、 b [1]から適応。 c [111]から改作。 d [112]
から改作ラマン散乱において、入射ポンプ光子(| r )によって課せられる摂動の中間状態 〉と| l 図1a、b)の〉は一般にシステムの電子状態に対応せず、仮想エネルギー状態と呼ばれます。これらの仮想中間状態は、システムの明確に定義されたエネルギー状態を表していません。ポンプ光子の周波数が電子状態のエネルギーに近づくと、共鳴効果のためにラマン効果の強度が増加し、共鳴前ラマンと呼ばれます。中間状態が離散電子エネルギー状態に対応する場合、相互作用は共鳴ラマン散乱として記述され、信号強度は仮想中間状態ラマン散乱の信号強度を桁違いに超えると予想されます。入射光のエネルギーが解離エネルギーレベルの範囲内にある場合、そのプロセスは連続体共鳴ラマン散乱として説明されます[1]。
特定の量子状態間のラマン散乱遷移は禁止されています。反転対称の材料(つまり、。 中心対称結晶構造[113])、初期状態と最終状態は同じパリティを持っている必要があり、吸収遷移(光学活性遷移)と相互に排他的です。言い換えれば、遷移はラマン活性または光学活性のいずれかである可能性があります。線形分子の場合、振動または曲げの対称伸縮モードはラマン活性であり、光学的に不活性です。反対称モードを持つものは、ラマン不活性で光学活性です(つまり。 相互に排他的)[1]。この規則は一般的であり、非線形分子の場合、相互排除は緩和されます。反転対称性のない材料では、(回転)振動モード遷移はラマンと光学活性の両方である可能性があります[1,108]。
エネルギー状態の母集団は熱統計によって支配されるため、分子のストークスラマン信号は反ストークス信号よりも強力です[1,108]。結晶中のフォノンなどのボソン系の場合、散乱ターゲットが特定の振動量子エネルギー状態を占める確率は、ボース-アインシュタイン統計に従います。非共鳴ラマン散乱と熱平衡の下で、反ストークス散乱強度とストークス散乱強度の比は[109]:
で与えられます。 $$ \ frac {I _ {\ mathrm {AS}}} {I _ {\ mathrm {S}}} ={\ left(\ frac {\ omega _ {\ mathrm {p}} + {\ omega} _ {\ mathrm {osc}}} {\ omega _ {\ mathrm {p}}-{\ omega} _ {\ mathrm {osc}}} \ right)} ^ 4 {e} ^ {\ left(-\ frac {\ mathrm { \ hslash} {\ omega} _ {\ mathrm {osc}}} {kT} \ right)} $$(8)ここで私 S および私 AS それぞれ、ストークス光と反ストークス光の強度です。ℏ プランク定数を2 πで割ったものです 、 k はボルツマン定数であり、 T 散乱種に関連する温度です。この方程式は、ラマン分光法によって温度を測定するために使用されることがあります[65]。ストークスプロセスと反ストークスプロセスは異なるポンプ光子周波数で発生するため、この関係は共鳴ラマン散乱では不正確になります[109]。
自然発生的なラマン散乱の場合、ラマン効果は非常に弱いです。通常、10 8 に1つ 入射放射線の一部は自発的なラマン散乱を受けます[6]。仮想励起状態から最終状態への遷移は、任意の時点で、確率に基づいて可能な最終状態に発生する可能性があります。したがって、自発的なラマン散乱はインコヒーレントなプロセスです。出力信号パワーは入力パワーに比例し、ランダムな方向に散乱し、偏波の方向に依存します。たとえば、ガス状分子のシステムでは、入射光に対する分子配向はランダムであるため、それらの偏光波数ベクトルもランダムになります。さらに、励起状態の寿命は有限であるため、遷移エネルギーには関連する不確定性があり、ハイゼンベルクの不確定性原理( ∆E∆t )に従って波長の自然な線の広がりにつながります。 ≥ℏ / 2)[1]。散乱光は、一般に、入射光とは異なる偏光特性を持っています。さらに、強度と偏光は、光が測定される方向に依存します[1]。散乱スペクトルは、すべてのラマンアクティブモードでピークを示します。スペクトルピークの相対強度は、各ラマンモードの散乱断面積によって決定されます[108]。ラマン散乱はレイリー散乱よりもはるかに可能性が低いため、ラマン散乱が発生する前に、光子は連続的なレイリー散乱イベントを受ける可能性があります。
非線形感受率
式で記述される分極。 3は一次(つまり。)と一致しています 線形)光学系であり、単一光子散乱プロセス(2光波混合プロセス)について説明しています。 3つ以上の波を使用する波混合プロセスでは、混合電界成分の積のために非線形光学偏光を考慮する必要があります。非線形光学偏光は、[110]次のように説明できます。
$$ {P} _j ={\ varepsilon} _0 \ left [{\ chi} _ {jk} ^ {(1)} {E} _k + {\ chi} _ {jk l} ^ {(2)} {E } _k {E} _l + {\ chi} _ {jk lm} ^ {(3)} {E} _k {E} _l {E} _m + \ dots \ right]、$$(9)ここで、χ (2) は2次感受率(ランク3テンソル)、χ (3) は3次の感受率(ランク4のテンソル)であり、繰り返される添え字インデックスの合計が再び暗示されます。式の各項。 9は、\({\ overset {\ rightharpoonup} {P}} ^ {(1)} \)、\({\ overset {\ rightharpoonup} {P}} ^ {(2)} \)で省略して記述できます。 、\({\ overset {\ rightharpoonup} {P}} ^ {(3)} \)など。2次分極のために発生する物理プロセス\({\ overset {\ rightharpoonup} {P} } ^ {(2)} \)は、3次分極\({\ overset {\ rightharpoonup} {P}} ^ {(3)} \)から生じるものとは異なる傾向があります。この分極は、電気双極子、四重極、八極子などの寄与を持つ可能性があります。電気双極子近似では、2次分極は、中心対称でない(反転対称性がない)結晶でのみ発生します。したがって、χ (2) 流体などのメディアでは消えます(例:。 液体/気体)およびアモルファス固体(例:。 ガラス)。 3次の非線形光学相互作用(つまり、。 χで記述されたもの (3) 感受性)は、中心対称システムと非中心対称システムの両方で発生する可能性があります[109、110]。電気四重極、八重極など)χ (2) 反転対称性の下では、寄与は消えません。
誘導ラマン散乱
自発的ラマン散乱はインコヒーレントプロセスですが、SRSはコヒーレント4光波非線形光学混合プロセスです。振動のモードは同相であり、感受性χでサンプルの偏光のコヒーレント変調を形成します。 (3) (ω S ; ω p + ω S − ω p )[110]。散乱光もコヒーレントです[45]。 SRSプロセスは、自発的なラマン断面積、スペクトル線幅、ライトフィールドと物質の相互作用の経路長、入力強度、およびストークス周波数光の光フィードバック(光生成)に依存します[110]。
>周波数ωの光子の場合 p およびω S 基底状態の分子または結晶格子と同時に相互作用し、システムは誘導周波数で振動します:ω osc =ω p − ω S 。自発的なラマン散乱とは異なり、最終状態までの脱励起(緩和)時間とエネルギーは、刺激効果によって決定されます。相互作用により、ポンプ光子から分子/格子にエネルギーが移動し、分子/結晶は、周波数ωの入射光と一致する周波数と位相を持つ新しい光子を散乱させます。 S 。図2aは、プロセスを概略的に示しています。
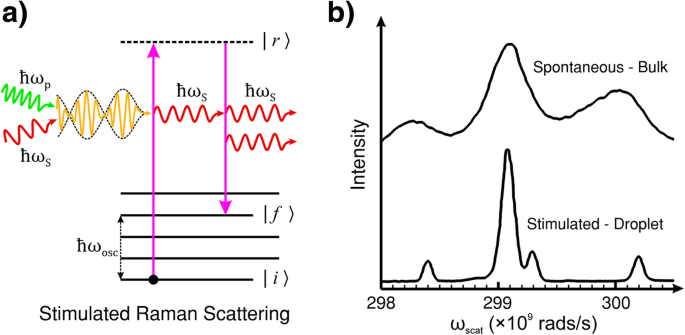
a 誘導ラマン散乱(SRS)のエネルギー準位図。 SRSは、ポンプとストークス光と材料とのコヒーレント相互作用によるストークス光の誘導放出です。状態の寿命が | r〉 である自発的ラマン散乱とは異なり そして最終状態のエネルギー | f〉 SRSでは、分子または格子の(ro-)振動は、ポンプとストークス光の周波数差によってコヒーレントに駆動されます。 b バルクおよび液滴エタノールの自発ラマン散乱とSRSの比較。自発的測定はキュベット(バルクエタノール)で行った。 SRS測定は、ストークス光の光共振器として機能するエタノールの液滴で実行されました。 b OSAの許可を得て複製[114]
この効果を誘発するために、ポンプレーザービームと並行してストークス周波数に調整された外部放射線源を使用するのが一般的です。この手法は、ポンプ放射からエネルギーを伝達することにより、ストークス信号の指数関数的増加と、最終的な(回転)振動状態の急速な増加につながる可能性があります| f 〉 [115]。ただし、周波数ωの入射光の強度が p 十分であれば、材料内でのストークス周波数光子の生成は、外部のωを必要とせずにSRSを自己促進することができます。 S ソース。この種の自己生成SRSのエタノールなどの有機液体の入射光の強度しきい値には、通常、ポンプ光の入射ピーク強度> 10 9 が必要です。 W / cm 2 数センチメートルの光路長の場合。ただし、SRSしきい値は、ポンプの長さを延長し、液滴内の内部反射など、光共振器とのストークスフィールドの相互作用を延長することで大幅に減らすことができます。図2bに示す例は、バルクエタノールの自発ラマンスペクトルと直接比較したエタノールの液滴で取得したSRSスペクトルです。液滴は、ストークス光を自己SRS誘導光共振器としてフィードバックする内部反射によって光を閉じ込めるように作用します[114]。
コヒーレント反ストークスラマン散乱
CARSは、3次の非線形4光波混合プロセスです。図1bは、プロセスのエネルギー準位図を示しています。周波数ωのポンプビームとプローブビーム p およびω pr 周波数ωの3番目のビームと混合されます S (ストークス頻度)およびサンプルへの入射。周波数差(ω p − ω S )ラマンアクティブ(ro-)振動モードωに関連する周波数と一致する必要があります osc =ω p − ω S [4、53、56、116]。ストークスビームの周波数は通常、この基準を満たすように調整/調整されます[117]。次に、周波数ωのプローブ光子 pr 周波数ωで発生する反ストークス散乱プロセスの摂動を提供します AS =ω p − ω S + ω pr [5]。巨視的な3次偏光 P (3) は、微視的な双極子振動のコヒーレントな重ね合わせによって引き起こされます[53]。したがって、CARSは次の形式の3次感受性によって支配されます:χ (3) (ω AS ; ω p − ω S + ω pr 。
χの式を作成するには、さまざまな処理とアプローチがあります。 (3) 。励起場が分子内力よりもはるかに弱いと仮定すると、摂動アプローチを採用できます[5、110]。そうでない場合は、非摂動療法を検討することができます[118]。システムの密度行列方程式を考慮し、外部場の相互作用をハミルトニアンの摂動として表現することにより、半古典的非線形光学理論はχの式を生成します。 (3) 48の項があり、それぞれが3次の感受率に寄与します[5]。共鳴CARSの支配的な項の一般化された式は、次のように与えられます[51、119]:
$$ {\ chi} ^ {(3)} =\ frac {A_R} {\ omega_ {osc}-\ left({\ omega} _p-{\ omega} _S \ right)-i {\ Gamma} _R} + {\ chi} _ {NR} ^ {(3)}、$$(10)ここで、Γ R ラマン線の半値全幅です[51]。 A R ラマン散乱断面積を表す定数です。第1項は、図1b(ω)のようなCARS振動共振による寄与です。 osc =ω p − ω S )。 2番目の項は非共鳴バックグラウンド信号であり、ラマンシフト(ω)とは無関係です。 osc ≠ω p − ω S )。非共鳴バックグラウンドは、散乱プロセスのすべての量子経路が(回転)振動状態との共鳴を伴うわけではないために発生します。この非共振の寄与は、信号の共振部分に干渉します。非共鳴バックグラウンドは、自発的なラマンスペクトルと比較してCARSスペクトルに特有の歪みを引き起こし、CARSが普及した技術になるのを妨げてきました[120]。
異なる周波数の入射光ビームは、時間と空間の両方で互いに同相および異相に移動します。したがって、フィールドとサンプルの相互作用の長さのスケールがコヒーレンスの長さのスケールよりも小さい場合、CARS信号は最初の最大値に達し、建設的な干渉が発生します[121、122]。 平面波の場合 ポンプおよびストークスビームの場合、反ストークス信号の強度は次のとおりです[53、123]:
$$ {I} _ {\ mathrm {AS}} \ propto {\ left | {\ chi} ^ {(3)} \ right |} ^ 2 {I} _ {\ mathrm {p}} {I} _ {\ mathrm {p} \ mathrm {r}} {I} _ {\ mathrm {S}} {\ left(\ frac {\ sin \ left(\ Delta \ overset {\ rightharpoonup} {k} \ bullet \ frac {\ overset {\ rightharpoonup} {z}} {2} \ right)} {\ frac {\ left | \ Delta \ overset {\ rightharpoonup} {k} \ right |} {2}} \ right)} ^ 2 、$$(11)ここで、\(\ overset {\ rightharpoonup} {z} \)はサンプルの厚さ(格子セル表面に垂直なベクトル)、\(\ overset {\ rightharpoonup} {k} \)は光の波数ベクトル\(\デルタ\ overset {\ rightharpoonup} {k} ={\ overset {\ rightharpoonup} {k}} _ {\ mathrm {p}}-{\ overset {\ rightharpoonup} {k}} _ {\ mathrm {S}} + {\ overset {\ rightharpoonup} {k}} _ {\ mathrm {p} \ mathrm {r}}-{\ overset {\ rightharpoonup} {k}} _ {\ mathrm {AS}} \)は波数ベクトルです不一致(4つの波の間の速度差)と I i 下付き文字で示される波の強度です。位相整合は、\(\ Delta \ overset {\ rightharpoonup} {k} =0 \)のときに達成され、エネルギーと運動量の伝達プロセスが許可された遷移に対応するため、反ストークス信号の強度が最大になります。 χの大きさとして (3) はプロセスに関与する発振器の数に直線的に比例し、反ストークス信号の強度は発振器の数/濃度に二次的に比例します[53]。
研究者は通常、ポンプビームを使用して、2番目の仮想励起(つまり。)を提供します。 図1bに示すプローブライト。つまり、ω pr =ω p およびω AS =2 ω p − ω S )[119]。したがって、CARS信号の強度は、ポンプビームの強度に二次関数的に比例します(式11を参照)。位相整合条件により、CARS信号は単方向です[120]。ただし、位相整合ビームアライメントを実現するための複雑な機械システムを必要とせずに、位相整合条件を満たすために、高開口数(NA)レンズまたは顕微鏡対物レンズ(共焦点光)が一般的に使用されます[5、117]。
ラマン共鳴のコヒーレンス時間は通常〜1psです。したがって、ポンプビームとストークスビームは通常、ピコ秒のタイムスケールでパルス化され、コヒーレント励起を取得し[124]、多光子効果を抑制します[53]。 CARSプロセスは、ビームの焦点のすぐ近くで行われます。生成される信号は通常10 6 自発ラマン散乱の倍。 CARS顕微鏡は、高感度とスペクトル分解能、および3次元セクショニング機能を備えた(回転)振動スペクトルの非侵襲的特性評価とイメージングを提供します[116]。
表面プラズモンとポラリトン
表面プラズモンは、誘電体と、金属や縮退した半導体などの導電性材料との間の界面で発生する可能性があります[88、125]。それらは、平衡位置を中心とした表面伝導電子の光誘起コヒーレント振動です。残っている反対の電荷のナノスケールのボリュームは、電子の復元力として機能します。結果は、減衰単純調和振動子モデルで説明できます。このモデルでは、自由電荷キャリアの振動に関連する共振があります。表面プラズモンは、EM放射とプラズモンによって励起される可能性があります これらの光と物質の相互作用の研究です[126]。
入射光の波長よりもはるかに小さいプラズモンナノ粒子は、局所表面プラズモン共鳴(LSPR)として知られる周波数で振動する非伝播表面プラズモンをサポートすることができます[127、128]。表面プラズモンの波長は、特定の周波数で関連する伝搬光の波長よりもはるかに短い[129]。 LSPRの波長は、ナノ粒子のサイズ、形状、材料、外部誘電特性、およびナノ粒子間の分離に依存します[85、127、128、130、131、132、133]。
伝播する表面プラズモンは、表面プラズモンポラリトン(SPP)と呼ばれます[134,135,136]。それらは本質的に、導電性材料の自由電子との相互作用のために界面にトラップされる光波です[88]。平面誘電体伝導界面の場合、ポラリトンは表面界面に沿って2次元空間を伝播し、長さは数十から数百マイクロメートルになります[126、134、135、136]。それらは、表面界面に垂直な方向にエバネセントに減衰し、1 / eの減衰長は最大200nmです[126、137]。このエバネッセント減衰領域の電界強度は、入射放射線に対して10から100のオーダーで増幅されます[136]。したがって、表面に吸着された分子との光と物質の相互作用も強化されます。
LSPRの場合、表面粗さまたは表面ナノ粒子が電荷キャリアの局所濃度を引き起こし、避雷針効果によりエバネセント電磁場をさらに増幅します[138]。さらに大きなフィールドエンハンスメント(最大10 6 )ギャッププラズモン(2つの隣接するプラズモンナノ粒子間のギャップ。図1cを参照)で観察できます[85、111]。この強化された近接場効果により、SERSと呼ばれる手法が生まれます。これについては、次のセクションで説明します。
表面増強ラマン散乱
ラマンは一般的に非常に弱いプロセスです。 10 8 ごとに約1つと推定されます 光子は自発的にラマン散乱を受けます[6]。この固有の弱点は、取得可能なラマン信号の強度に制限をもたらします。入射レーザー出力を上げたり、顕微鏡の対物レンズを使用してレーザービームを小さな領域にしっかりと集束させるなど、さまざまな方法を使用して実験のラマンスループットを上げることができます。ただし、これはサンプルの光退色などの悪影響をもたらす可能性があります[139]。分析物を粗い金属表面に配置すると、測定されたラマン信号を桁違いに向上させることができます。つまり、。 SERS。
SERSによって提供されるラマン信号の増加を説明するために2つのメカニズムが提案されています。 1つ目は、EM強化によるもので、局所表面プラズモンが、ナノ構造の鋭いエッジにある「ホットスポット」または照明ロッド効果により集中した自由電荷キャリアの領域に金属の表面近くの局所電場を集中させます[140 ]。図1cは、SERSプロセスを示しています。このプロセスにより、ラマン生成が10 8 増加する可能性があります。 〜10 11 [86、141、142、143、144]。 2番目の方法は、金属表面と分析物の間の電荷移動による化学的強化です。これにより、ラマン散乱が約10 2 向上します。 〜10 3 [86、145、146、147]。ただし、電荷移動メカニズムは特定の分子にのみ適用されますが、EMメカニズムはすべての分析物に適用されます[4、92、102、148]。
EM増強の遍在性は、多くのSERS基板の開発につながりました。これは、固体基板上に作製された金属ナノ構造[85]とプラズモンナノ粒子のコロイド懸濁液[96、141]の2つのグループに分けることができます。 SERS基板の製造に使用される最も一般的な材料は、プラズモン応答が良好なため、金と銀です[149]。金は貴金属であるため、化学的安定性の恩恵も受けます。 UVラマン分光法用のアルミニウムなどの他の金属も調査されています[150、151]。
ヒントで強化されたラマン散乱
光の回折限界は、標準的な光学技術(ラマン分光法など)の焦点スポットサイズを、アッベの基準[152,153,154]に従って光の波長の少なくとも半分に制限します。サンプルからの光は、伝播する放射と伝播しない放射の両方で構成されます。非伝播エバネッセント波はそれらのソースの近くに残り、遠方界での画像形成に関与しません。代わりに、それらはプラズモン活性部位の間でサンプル上で横方向に伸びます。したがって、空間分解能は、光の焦点のサイズによって制限されます。焦点スポットのサイズが半波長(可視光の場合は〜250 nm)であっても、半波長よりもはるかに小さいオブジェクトは、デフューズ形状として表示されます。
TERSは、ラマン分光法と散乱(または開口なし)走査型近接場光学顕微鏡法を組み合わせた比較的新しい光学ナノイメージング技術です。 TERSは、プロービングライトの回折限界をはるかに超える空間分解能を提供します。先験的な説明の文脈では、これは、近距離場のエバネッセント光を遠距離場の像形成に強制することによって達成されます[86]。現在、TERSの空間分解能は通常10〜30 nmと報告されており、主に先端の頂点のサイズに比例すると想定されています[103、155、156、157]。この解像度の段階的な改善が報告されています[104、158]。プローブされた信号ボリュームの相対的なサイズのため、TERSのエンハンスメントファクターはSERSよりも大幅に弱くなります。増強係数(自発的ラマン散乱と比較して)は通常、10 3 であると報告されています。 〜10 6 。 SERSと同様に、ラマン信号には2つの電界増強メカニズムが寄与していると考えられています。EMと化学的増強です[86]。
TERSは、プラズモン活性(プラズモン)ナノチップをサンプルの関心領域の約50nm上に配置することによって実装されます。ラマンプローブ光は、チップ表面の空洞に焦点を合わせて、チップの頂点と(状況によっては)サンプル表面内にLSPRを誘導します。次に、表面プラズモンは、入射プローブ光および/またはラマン散乱光でエバネッセントまたは近接場光を増強することができる。したがって、LSPRは、先端の頂点付近のライトフィールドを閉じ込めて強化します。強化された局所電磁界は、避雷針効果により、先端の頂点に最も集中します。先端の頂点でのこのエバネッセント光は、先端の下のサンプルのナノスケールボリュームからのラマン、2光子または第二高調波散乱を励起または刺激することができます。サンプル表面のラマン画像は、ナノメートルチップの下でサンプルをラスタースキャンすることで取得できます。
実験上の考慮事項
計装
非共鳴ラマン効果は非常に弱いプロセスです。したがって、高品質のラマンスペクトルを生成するには、単色、狭ビーム、高強度のレーザーが適しています。ステッピングモータードライブ、フォトンカウンター、デジタルデータ取得、計算処理システムなどのマイクロエレクトロニクスを活用することで、スペクトルの品質をさらに向上させることができます。自発的ラマン分光法は当然インコヒーレントなプロセスであるため、パルスレーザーは十分な信号対雑音比のためにより高いピークパワーを必要とし、サンプルを光退色/損傷する可能性があるため、連続波レーザー光源が一般的に使用されます。
レーザー光源の波長の選択は、必要なアプリケーションによって異なります。より低い可視波長とUVは、有機材料に強いフォトルミネッセンスを引き起こし、ラマンピークをマスクする可能性があります。したがって、フォトルミネッセンスが低下するため、より長い可視波長または近赤外波長(500〜830 nm)のレーザー光源が有機材料の研究に適していることがよくあります。ただし、ラマン信号強度はポンプ光の波長に反比例します。したがって、光の波長が長くなると、取得時間が長くなります[1、6]。
ラマン分光法は、ほとんどの場合、λのレーザー光源を使用して実行されます。 =785nm。この波長源は、ラマン信号強度、蛍光、検出器の感度とコスト、および費用効果が高くコンパクトな高品質のレーザー源の間の競合要因のバランスをとるために選択されることがよくあります。ただし、青と緑の可視レーザー(例:.λ =532 nm)はラマン分光法でより一般的になりつつあります[159]。
ラマン散乱は、光源の波長からの波長シフトの観点から測定されます。理想的には、ラマン測定の照明源は純粋に単色、つまり単一波長である必要があります。ただし、すべてのレーザー光源は、線幅と呼ばれる波長のスペクトルを持っています。レーザーの線幅は通常ヘルツで測定され、ラマンアプリケーションで使用される固体レーザーの場合は通常> 1MHzです。ラマン散乱プロセスで測定されるシフトはレーザーの線幅によって制限されるため、ラマン分光法には狭い線幅が適しています。
ラマン分光法用のレーザー光源は、長期間にわたって、使用から使用まで、波長と出力が安定している必要があります。ラマンスペクトルは通常、長い積分時間と多くの取得で収集されます。ラマンはポンプ光に対するシフトとして測定されるため、測定中に光源の波長がドリフトすると、ラマンピークもドリフトします。波長ドリフトは、ピークをシフトさせ、測定間の比較を困難にするため、測定ごとに問題があります。同様の理由で、電源の出力電力の安定性も重要です。レーザー出力が測定ごとに変動する場合、定量的な比較を簡単に行うことはできません。
スペクトル純度は、ラマンレーザー光源のもう1つの重要な基準です。レーザー光源のスペクトル純度は、多くの場合、60dBよりも優れたサイドモード抑制を必要とします。多くの場合、レーザー波長のピークから〜1–2nmで> 60 dBのスペクトル純度に達した場合は、サイドモード抑制で十分です。ただし、より長い波長(近赤外)ラマン分光法では、メインピークから数百pm以内のサイドモード抑制比が必要です。これらの基準は、次の段落[159]で一般的なラマンレーザー光源のコンテキストで説明されています。
最新のラマンシステムのほとんどは、スペクトルの品質と安定性のために、ガスレーザーではなく固体レーザー光源を使用しています。ラマン分光法で使用される連続波固体レーザー光源には、主に3つのカテゴリがあります。ダイオード励起単一縦モード(SLM)レーザー。シングルモードダイオードレーザー(分散フィードバック(DFB)または分布ブラッグ反射(DBR));およびボリュームブラッググレーティング(VBG)周波数安定化ダイオードレーザー。これらのレーザー光源にはさまざまな光学特性があります。
ダイオード励起SLMレーザーは、UVから近赤外までコンパクトな形で容易に入手できます。近赤外で1064nmで数ワットの電力レベルを達成できます。可視範囲では、青緑赤領域(457〜660 nm)の多数のラインが、出力電力〜100mWで利用できます。 UVスペクトル範囲では、355 nmで10〜50mWの出力が利用可能です。エルミート-ガウスレーザービームモードは、横電磁モード(TEM)で表されます:TEM m、n 、ここで、mとnはエルミート-ガウスモードインデックスを表します[46]。ダイオード励起SLMレーザーは、優れたTEM 00 を提供します モードビーム、低ドリフトの正確な波長、および単一周波数の線幅> 1MHz。ダイオード励起SLMレーザーのスペクトル純度は、サイドモード抑制比で通常> 60dBです。スペクトルシフトで数ナノメートルのレーザーのメインピークに隣接する弱い放出は、ダイオード励起SLMレーザーで発生する可能性があります。ただし、これらの隣接するラインは、誘電体バンドパスフィルターを使用して軽減できます。ダイオード励起SLMレーザーの波長は、通常、30°Cの温度変化で4pm以内に安定しています。
シングルモードダイオードレーザーは、単一周波数線幅(> 1 MHz)、単一TEMビーム品質、および最大100mWの出力パワーを備えたコンパクトで費用効果の高いポンプ照明光源です。 λの波長 =785、830、980、および1064 nmは、ラマン分光法で最も一般的です。サイドモード抑制比は、通常、サイドバンド放射によってメインピークから〜100 pmで〜50dBに制限されます。
VBG周波数安定化ダイオードレーザーは、狭線幅のVBGエレメントとダイオードレーザーエミッターを使用して、狭線放射を実現します。これらのレーザーは、DFBまたはDBRレーザー光源では利用できない波長での細線放射を必要とするアプリケーションによく使用されます。周波数ロッキングマルチTEMダイオードレーザーを使用して、狭い線幅の発光の出力を高めることができます。出力波長と線幅の安定性には、VBG周波数安定化ダイオードレーザー内での注意深い熱機械的制御と高精度の位置合わせが必要です。線幅は、波長と出力電力に応じて、単一周波数放射から数十pmまでの範囲になります。サイドモード抑制比は、メインピーク発光から〜50 dB、〜250pmに制限されています。ただし、これはフィルターを使用して改善できます。
共焦点ラマンイメージングアプリケーションでは、回折限界TEM 00 を使用する必要があります 最適な空間分解能のためのビーム。ただし、これはプローブベースの定量的ラマン分析では緩和されます。さらに、共焦点ラマンセットアップでは、サンプルが入射ポンプ光に適切に位置合わせされた光フィードバックを生成する可能性があるため、レーザービームの分離が必要です。この逆伝播フィードバックは、パワーとノイズの不安定性を引き起こし、レーザー光源に損傷を与える可能性さえあります。光アイソレータは、アイソレータの後の出力で注意深い位置合わせを行う必要があるため、レーザーシステム自体に統合されることがよくあります[4、6、159]。
分光計は、ラマンスペクトルの測定に使用されるセットアップのコアコンポーネントです。分光計は、使用するレーザー光源の波長と一致している必要があります。必要なスペクトル範囲と解像度は、アプリケーションによって異なります。たとえば、スペクトル範囲は、対象のラマンピークの位置によって決定されます(つまり、。 全体として\(\ Delta \ overset {\ sim} {\ nu} \)〜3000 cm -1 または低い\(\ Delta \ overset {\ sim} {\ nu} \)〜1 cm -1 )。アプリケーションで間隔の狭いラマンピークを分離する必要がある場合は、スペクトル分解能が重要です。分光計のスペクトル分解能は、主に、分光計入口のスリット幅、分光計の焦点距離、分散、回折格子(またはプリズム)のサイズ、および検出器のサイズと感度/品質によって決まります。特定のアプリケーションの実験計画を検討する場合、全体的なスペクトル範囲と解像度の間にはトレードオフがあります。弱いラマン信号の場合、信号対雑音比の最適化が優先されます。
スペクトルフィルタリングは、ラマンスペクトルの取得に重要な役割を果たします。第一に、入射レーザー光はスペクトル的に純粋でなければなりません。これは、前述のように線幅の狭いレーザー光源を使用して実現されます。ただし、レーザー光が光ファイバーによってサンプルに照射される場合、ラマンの生成が光ファイバーで発生することは避けられません。したがって、狭帯域通過フィルターを使用して、レーザーをサンプルに供給する際に生成されるラマン信号を排除することが重要です。狭帯域通過フィルターは、レーザー波長で> 90%の透過率を提供し、レーザー波長とわずか1%異なる波長で光をOD> 5の光学密度に抑制します。
重要なことに、検出のために収集された光は、レーザー波長を遮断するためにフィルタリングを必要とします。レーザー光がフィルターで除去されない場合、セットアップの検出アームでラマンを生成し、分光計に到達したときに目的のラマン信号をかき消す可能性があります。必要なフィルターのタイプは、ストークス、アンチストークス、またはその両方を測定するかどうかによって異なります。反ストークスラマン光のみを検出するには、レーザー光源よりもエネルギーが高く、したがって波長が短いため、ショートパスフィルターを使用する必要があります。ストークスラマンのみを検出するには、ロングパスフィルターを使用する必要があります。ストークスラマン光はレーザー光源よりもエネルギーが低く、波長が長いためです。エッジ遷移幅が<3nm、エッジの急峻度が<40 cm -1 のロングパスエッジフィルター 利用可能です。ストークス光とアンチストークスラマン光の両方を検出するには、レーザー波長を中心としたノッチフィルターを使用する必要があります。これにより、短波長と長波長の両方を検出できます。レーザーライン波長でOD> 6のノッチフィルターが利用可能です。マルチノッチフィルターも利用可能で、複数のレーザーラインを同時にブロックできます。ホログラフィックノッチフィルターは、誘電体ノッチフィルターよりも大幅に優れており、50 cm –1 近くの光を通過させながら、レイリーラインの優れた減衰を提供します。 レイリーラインから。音響光学変調器は、励起レーザーと組み合わせて使用して、(フィルターとして)目的の波長の放射を選択することもできます[160]、またはタッピングモード原子間力顕微鏡(AFM)ベースのTERSのタイムゲート照明システムとして使用することもできます[160]。 161]。
ラマン信号検出用の標準的な室温シリコンベースのCCDデバイスの量子効率は、λを超えると縮退します。 =800nm。より長い波長の場合、インジウムガリウムヒ素アレイデバイスを使用できますが、これらは感度が低く、ノイズレベルとコストが高くなります。
可視から近赤外の波長範囲(λ =500–830 m)は、無機材料(グラフェン、カーボンナノチューブ(CNT)、フラーレンなど)およびSERSに特に適しています。 UVレーザーは、有機物(病原体、タンパク質、DNA、RNAなど)にとって魅力的です。近赤外照明を必要とする強い蛍光を伴う材料の場合、1064nmの波長を使用するのが一般的です。
自発的でコヒーレントなラマン散乱のセットアップ
自発的ラマン分光法は、単一光子の吸収または発光実験が禁止されているモードで最も一般的に使用されます[108]。 SRSは、コヒーレント光の波長シフト、光増幅、パルス圧縮、位相共役、およびビーム結合に使用されることがあります[108]。自発的ラマン散乱とは異なり、SRSは指向性が高く、信号強度が向上し、コヒーレント(回転)振動運動の進化と位相緩和を時間分解する機能を提供します[45]。
図3aは、Wiedemeier etal。が使用した共焦点形状に基づく典型的なラマンセットアップを示しています。 [162]。このタイプの共焦点セットアップは一般的に使用され、ポンプ光の焦点を合わせるために無限遠補正された対物レンズ(大開口数(NA)レンズ)を採用しています。 Wiedemeier etal。 [162]は、532nmを中心とする単色光源としてダイオード励起固体レーザーを使用しました。共焦点モードは、分光計の前にあるピンホールモジュールを使用して光を空間的にフィルタリングすることで実現されます。ピンホールは、焦点面から発生した光のみを検出器に渡します。 For detection of the Raman signal, a holographic-imaging spectrometer with an attached CCD camera is used. A holographic transmission grating with high light throughput served as a dispersive element, which enables large spectral ranges in a comparatively short time period to be acquired. Raster scanning of the sample in a confocal setup needs to be precise. Hence, a piezo actuated nano-positioner is used for positioning of the specimen.

a Typical confocal Raman spectroscopy setup. The pump laser is spatially filtered through a pinhole. The back-scattered Raman light is spatially filtered and spectrally filtered through a notch filter. The Raman light is analysed by a spectrometer and a charge-coupled device (CCD). Hyperspectral images are obtained by raster scanning the sample. b Typical CARS setup. Two laser sources provide the pump and Stokes light and are synchronised through a picosecond path difference mirror setup. In this setup, the incident light is focused through an optically transmissive sample substrate. Both the forward scattered light (F-CARS) and epi-scattered light (E-CARS) are spectrally filtered by band-pass filters and are subsequently detected by two avalanche photodiodes. CARS images are obtained by raster scanning the sample. c Typical SERS setup. The pump laser is coupled into a dark-field microscope in which the Raman light is edge-filtered and detected through a monochromator and EMCCD. The white-light source and dark-field mask provides the means for dark-field spectroscopy. The dark-field spectra of each plasmonically active nanoparticle are recorded through a secondary spectrometer (top right in c )。 An imaging CCD camera is used to automatically find and centre each nanoparticle. d Typical TERS setup. The pump laser light is spatially filtered and passed through a half-wave plate. The evanescent mask ensures that only high numerical aperture (NA) pump light is incident on the sample such that total internal reflection occurs at the substrate-sample interface. This ensures that the tip apex is only illuminated by the evanescent light to achieve nanoconcentrated light in the vicinity of the tip. The reflected Raman light is filtered by an apertured mask (to remove any residual large NA pump light) and a notch filter. The Raman light is analysed by a spectrometer and a CCD. Hyperspectral images are obtained by raster scanning the sample. F, filter; M, mirror; RL, Raman light; CCD, charge-coupled device; PH, pinhole; BE, beam expander; D-BS, dichroic beam splitter; OBJ, Large numerical aperture (NA) lens; EMCCD, electron-multiplying charge-coupled device. a adapted from [162]. b adapted from [116]. c adapted from [85]. d adapted from [86]
Spontaneous anti-Stokes scattering is weaker than Stokes Raman scattering due to the relatively low probability of thermal excitation. Hence, anti-Stokes Raman spectroscopy is typically used with stimulated or coherent spectroscopy. CARS spectroscopy offers a 10 5 increase in conversion efficiency, spectral and spatial discrimination against fluorescence and, most importantly, does not require a monochromator. Due to the required coherence of the process, high-peak power pulsed tuneable laser sources are employed. These peaks are readily available using picosecond or femtosecond light lasers, the choice of which is determined by the spectral resolution required and the timescale of interest [139].
Avoiding direct electronic excitations in the sample is an important consideration as photochemical damage (due to photobleaching) can occur in samples. Djaker et al. [139], for example, use near-infrared laser sources to mitigate photobleaching in their samples of polystyrene beads.
Figure 3b shows a typical CARS setup that measures both forward scattered light (F-CARS) and back- or epi-scattered light (E-CARS) [116, 139, 163]. The system has two synchronised picosecond pulse trains. The pump and Stokes beams are generated by two picosecond Ti:Sapphire lasers operating at 80 MHz and are tuneable from 700 to 1000 nm to cover the entire spectrum of molecular (ro-)vibrations in biological systems (up to \( \Delta \overset{\sim }{\nu } \) ~ 3000 cm −1 )。 The ps pulse duration is adjustable by a Gires-Tournois interferometer. The Ti:Sapphire lasers are pumped by a frequency-doubled CW Nd:Vanadate laser that provides monochromatic light at 532 nm. The two pulse trains were polarised with a pulse duration of 3 ps, corresponding to a spectral width of 1.76 cm −1 。 The pump and Stokes beams are synchronously pulse picked through two Bragg cells to reduce the repetition rate of the pulse trains to several hundred kilohertz, thus avoiding photodamage of the sample while still maintaining high-peak power for CARS generation. The pump and Stokes beams are temporally synchronised by a SynchroLock system, which electronically adjusts the time delay between the two pulse trains. A small part of the output of the lasers are launched in optical fibres coupled to photodiodes and connected to a SynchroLock controller, which measures the lasers frequency or phase difference between the master and the slave; the timing jitter was reported to be ~ 250 fs. The spectral resolution was estimated to be 2.5 cm −1 , which is high enough to resolve Raman spectral features of biological samples. The use of a broadband Stokes wave enables the acquisition of a full CARS spectrum in only one measurement, with this configuration being known as multiplex or broadband CARS [164,165,166,167].
The two pulse trains are spatially filtered, collinearly combined and expanded through beam expanders. They are then sent into an inverted microscope and focused onto the sample by a water-immersion objective lens with a large NA. The E-CARS signal is collected by the same objective lens while the F-CARS signal is collected by a condenser lens with a lower NA. The E-CARS and F-CARS signals are filtered through a set of band-pass filters and detected by two avalanche photodiodes with a 200 μm × 200 μm active area. The CARS images are collected by raster scanning the sample, using an XYZ piezo flexure stage.
Several methods have been developed to suppress the nonresonant background associated with CARS. E-CARS is relatively insensitive to the nonresonant background of sample solvents [168]. Polarisation-sensitive CARS can differentiate the resonant and nonresonant signals by their polarisation [169]. However, these two techniques reduce the anti-Stokes signal strength [120]. Time-resolved CARS [170], temporal or spectral interferometry CARS [52, 171] and frequency-modulated CARS [172] can also suppress the nonresonant background. However, the setup in terms of both optics and electronics is challenging [120].
SERS Specific Considerations
A variety of nanostructures, such as bowtie antennas [173], nano-rings [174], nanovoids [175], nanoparticle aggregates [87, 176, 177], nanoflower [178], nanorod arrays [97] and nanowells [179] can be used for SERS. Each nanostructure can have a number of plasmonic resonances, and matching the excitation laser to these wavelengths can greatly enhance the SERS intensity [141, 180, 181]. Matching the plasmonic resonance to the pump laser can be done either by tuning the laser wavelength or by tuning the LSPR of the nanostructures [85, 182,183,184].
The difficulty faced in producing SERS substrates is consistency in fabrication and repeatability in measurements due to the inhomogeneity and randomness of SERS active hot spots [85, 185, 186]. For SERS substrates produced by top-down methods, such as electron beam lithography [187], the main challenge is scaling the fabrication. Conventional top-down methods limit the active area of the SERS substrate and are not conducive to large-area manufacturing. Bottom-up fabrication methods have their own set of problems. Even though bottom-up approaches allow wafer scale fabrication, consistency across the wafer is usually lacking [188]. This inconsistency hinders the repeatability of measurements, which is problematic for quantitative analysis. Colloidal SERS schemes suffer from complications introduced by stabilising agents at the surface of the nanoparticles, which help to keep nanoparticles in suspension. These stabilising agents can either impede or augment the measured Raman signal [189]. The chemical synthesis for nanoparticle colloids also requires precise optimisation. The poor reproducibility of nanoparticle colloidal synthesis hampers batch-to-batch consistency.
Often, only very few sites exhibit the highest SERS enhancement and the variability in size and shape can alter the plasmonic properties from the desired LSPR [85]. Figure 3c, shows a setup which combines SERS with dark-field spectroscopy. The dark-field spectrometer analyses the light scattered from the nanostructures (illuminated by the white-light source) to select nanostructures with the desired plasmonic properties.
TERS Specific Considerations
Scanning probe microscopy (SPM) techniques, such as atomic force microscopy (AFM), scanning tunnelling microscopy (STM) or shear force microscopy (SFM), are usually the tools of choice for TERS [86]. TERS has the ability to simultaneously measure topography by the conventional SPM mode of the system and obtain corresponding spectral information from a sample with nanometric spatial resolution and high sensitivity [86]. Certain SPM techniques ordain probe modifications for the plasmonically induced nanoscale evanescent light to activate/enhance the Raman signal. The tips can either be made of a metal or coated with a thin layer of metal to modify them for TERS. When the apex of a metallic or a metal-coated nanotip is illuminated with focused light at the LSPR wavelength, local surface plasmons around the tip apex are excited, and evanescent light is produced at the tip apex. This evanescent light can generate Raman scattering from a sample placed right under the tip apex. The process of Raman scattering takes place in the near-field and the spectral signal is scattered and converted back to the far-field by the tip apex, which is then collected by the usual optics and spectrometer in the far-field. Figure 3d shows such a TERS setup with a modified AFM. The setup consists of largely similar equipment shown in Fig. 3a (discussed in an earlier section). An inverted microscope illuminates the sample from underneath and the tip is placed at the top surface of the sample. The Raman back-scattered signal is then directed to the spectrometer. An evanescent mask blocks the central part of the laser beam inhibiting the low NA component of the incident light, so that only the high-NA component of the incident light reaches the sample so that total internal reflection occurs. This limits the transmitted light that falls onto the tip and, hence, only the evanescent light participates in the Raman scattering signal. Suppressing the participation of transmitted far-field light reduces the unfavourable background signal.
Polarisation-dependent TERS can be performed with light polarisation parallel to the tip apex in addition to the in-plane linear and radial polarisations. Polarisation dependent TERS is enabled by the large incidence angle from the high-NA objective lens and the use of devices that modify the polarisation state of the light such as a λ /2 waveplate [190]. The Raman scattered light is then collected in the low NA region through an apertured mask, which inhibits any residual laser light. As the tip apex approaches the sample within the focal spot, evanescent light is created at the tip’s apex [86]. Since the intensity distribution within laser focus is not uniform, it is very important to lock the relative position of laser focus to the tip [191, 192].
The strength and resolution of TERS depends on the ability of the tip to enhance and confine the light field at the tip’s apex, respectively. In STM systems, the tips are made of solid metal and the substrates need to be conductive in order to control the tunnelling current [193]. The STM tip resembles a long and smooth nanocone, with an apex diameter of ~ 20 nm. The length of the tip (~ tens of micrometres) makes them plasmonically unfavourable for visible light enhancement. However, the tunnelling gap between the tip and the sample can be tuned to the desired LSPR wavelength, creating a strong hotspot within the gap [143, 194, 195]. Some of the more advanced STM systems allow high-vacuum and low-temperature measurements [196]. As the substrate in STM needs to be conductive (often opaque in the visible wavelength range), the setup shown in Fig. 3d would not be suitable. Hence, a side illumination and side collection configuration is more common with STM-based TERS. To prevent the objective from mechanically interfering with the STM tip, a lens with a long working distance is required. It is therefore not trivial to tightly focus the incident light on the tip apex. A parabolic mirror can be used to mitigate mechanical interference and tightly focus the incident light to the tip apex as well as to collect the Raman signal [196, 197].
The spatial resolution in TERS is comparable to the size of the metallic nanostructure at the tip apex [86]. The gain in spatial resolution comes at a cost to overall signal enhancement (relative to SERS) due to the reduction of the Raman active volume.
In AFM systems, the tips are usually semiconductor cantilevers, with an apex diameter of ~ 5 nm. Figure 4 shows five examples of AFM-based TERS tips that have been demonstrated in the literature. The semiconductor tips are usually coated with metal either by thermal evaporation under high-vacuum [202] or electroless metal plating (mirror reaction ) [203] techniques. Figure 4a shows an example of a smooth AFM TERS tip. As the substrate does not need to be conductive, AFM-based TERS can be performed in either bottom-up transmissive illumination (as in Fig. 3d) or in side/top reflective illumination configurations; the transmissive configuration in Fig. 3d is more common.

a i Smooth metallic (silver; Ag) film-coated dielectric (silicon-dioxide; SiO2 ) atomic force microscope (AFM) tip. a ii SEM image of a Ag-coated AFM tip. After Ag coating by thermal evaporation, a thin granular Ag layer is deposited onto the tip. b i, Rough Ag-nanoparticle-coated SiO2 AFM tip. b ii SEM image of rough Ag-grain-coated SiO2 AFM tip formed during the thermal evaporation process. c i Single Ag nanoparticle attached to the apex of a SiO2 AFM tip. c ii SEM image of an AFM tip after photoreduction to selectively fabricate an Ag nanoparticle at the tip apex. d i Ag-coated SiO2 AFM tip with a focused ion beam (FIB) milled gap. d ii SEM image of antenna fabricated by FIB milling of annular ring and subsequent Ag thermal evaporation from under the tip. The mushroom shape shadows the annular ring from Ag coating. e i Illustration of side illumination TERS for surface plasmon polariton (SPP) nanofocusing. OBJ, objective. e ii Schematic of the tip structure for SPP nanofocusing which is composed of a SiO2 pyramidal structure (AFM tip) and a Ag film on the surface. The incident light is coupled to the surface by the FIB-fabricated grating nanostructure. e iii SEM image of a Ag-coated SiO2 tip with a FIB-fabricated grating structure. a i, b i and ii, c i reproduced from Ref. [198] with permission from The Royal Society of Chemistry. (ref.). a ii reprinted with permission from [86]. c ii Reprinted from [199] with permission from IOP. d i Adapted from [200]. d ii Reprinted from [200] with permission from IOP. e i Adapted from [201]. e ii and iii reproduced from Ref. [201] with permission from The Royal Society of Chemistry
The surface of AFM tips becomes nanostructured during the coating process resembling aggregated nanoparticles on the semiconducting tip (Fig. 4b) [198]. These nanostructures are suitable for the resonant excitation of LSPR and SPPs. The smooth tip shown in Fig. 4a has been fabricated by subsequently depositing a thin granular layer of additional metal. Other researchers have tested AFM tips with a metallic nanoparticle attached to the tip apex (Fig. 4c) [198], or a segregation in the tips coating to form an antenna (Fig. 4d) by focused ion beam lithography [115]. Tips can also be created by electrochemical deposition [204].
For transparent dielectric substrates, a thin metal film (thin enough to be transparent) can be coated onto the substrate to further enhance the field in the tip-sample gap [205]. It is also possible to perform TERS in liquids with AFM-based systems, which is favourable for biological specimens which require liquid environments to function [206]. Performing TERS in liquid with STM systems is much more difficult [86, 106]. SFM-based TERS is also an attractive technique and maintains many of the properties of AFM-based TERS with the exception of the tip material which resembles similar TERS properties of STM-based TERS [86, 156, 207, 208].
Some TERS setups have demonstrated vastly improved signal-to-noise ratio in TERS by SPP nanofocusing [201, 209, 210]. This technique focuses the laser onto a plasmon-coupling nanostructure (in the form of a grating) on the upper area of the tip, usually at a distance of ~ 10 μm from the tip apex. Figure 4e shows a typical nanofocused SPP-based TERS setup (i), the process of SPP nanofocusing by coupling the incident light to a focused ion beam-fabricated grating (ii), and an example SEM image of a SPP-nanofocusing tip (iii). The excited plasmons then propagate toward the tip apex through the process of adiabatic compression and create a confined EM field at the tip apex [209].
Tuning the Plasmon Resonance
The size, shape, composition of the nanostructures and inter-nanostructure spacing all affect the wavelength of the surface plasmon resonance [85, 86]. Metals are most often used as the conducting medium for surface plasmons; however, semiconductors also possess plasmonic characteristics [125]. Gold shows strong enhancement factors in the red spectral region [111, 177, 211, 212], silver in the blue-green spectral region [132, 213] and aluminium in the UV and deep UV spectral regions [150, 151, 175]. The blue-green spectral region is the most commonly used Raman spectroscopy range. However, silver is prone to oxidation which degrades the plasmonic characteristics within a few hours of exposure to atmosphere. For this reason, silver is often mixed with other metals, such as titanium [214].
The range of plasmon resonance can be tuned by the thickness and choice of coating metal, e.g. tungsten, gold, silver or aluminium. In TERS, the grain size of the metal coating corrugations (Fig. 4b) is roughly comparable to the wavelength of the LSPR/SSP. Unlike STM tips, it is possible to control the LSPR/SPP wavelength by adjusting the size of the nanoparticles. The surface plasmon resonance wavelength is also dependent on the refractive index of the dielectric material. In AFM-based TERS, for example, the silicon cantilever tip can be heated to ~ 1000 °C in the presence of water vapour to oxidise the silicon into silicon dioxide [215]. As SiO2 has a lower refractive index than Si, the surface plasmon resonance is blue shifted [86].
The size and shape of the metal-coated AFM tip apex can also be modified to tune the LSPR [199, 200]. Fabricating a single metallic nanoparticle attached to the tip’s apex (Fig. 4c) or segregated antenna-shaped tip (Fig. 4d) has been demonstrated as a means to finely tune the surface plasmon resonance in AFM-based TERS [199, 200, 208, 216]. However, the most commonly used tips for AFM-based TERS are the tips that have disconnected metal nanoparticles evaporated on a semiconductor cantilever in the standard coating process (Fig. 4b) described a priori [198].
Analysis Methods
A Note on Units
By convention, Raman spectra are considered in terms of the wavenumber \( \overset{\sim }{\nu } \) in units of cm −1 。 The conversion from angular frequency is as follows:
$$ \overset{\sim }{\nu }=\frac{\omega }{2\pi {c}_0}, $$ (12)where c 0 is the speed of light in vacuum and ω is the angular frequency. Raman spectra are usually plotted in terms of the wavenumber shift from the incident excitation radiation. This shift is defined as follows:
$$ \Delta \overset{\sim }{\nu }={\overset{\sim }{\nu}}_{\mathrm{p}}-{\overset{\sim }{\nu}}_{\mathrm{scat}}, $$ (13)where \( {\overset{\sim }{\nu}}_{\mathrm{p}} \) is the wavenumber of the pump beam with angular frequency ω p and \( {\overset{\sim }{\nu}}_{\mathrm{scat}} \) is the wavenumber of the scattered light accordingly. For Stokes Raman scattering, \( {\overset{\sim }{\nu}}_{scat}={\overset{\sim }{\nu}}_p-{\overset{\sim }{\nu}}_{osc} \) (where \( {\overset{\sim }{\nu}}_{osc} \) is the molecule or lattice vibration wavenumber) and \( \Delta \overset{\sim }{\nu } \) is positive. By contrast, for anti-Stokes Raman scattering, \( {\overset{\sim }{\nu}}_{scat}={\overset{\sim }{\nu}}_p+{\overset{\sim }{\nu}}_{osc} \) and \( \Delta \overset{\sim }{\nu } \) is negative [1].
Raman spectra are (by standard) presented with the wavenumber shift linearly increasing from right to left on the horizontal axis. The vertical axis ordinate is linear and proportional to intensity. However, researchers also present Raman spectra with wavenumber shift denoted simply as wavenumber and/or increasing from left to right instead of right to left [1].
Spontaneous Raman Spectra
Figure 5a shows the Rayleigh and the Raman spectrum of carbon tetrachloride (liquid) excited by an argon ion laser, \( {\overset{\sim }{\nu}}_1 \) ~ 20,487 cm −1 (487.99 nm). This spectrum is presented according to recommendations of the International Union of Pure and Applied Chemistry. It contains a strong band at \( {\overset{\sim }{\nu}}_1 \) ~ 20,487 cm −1 due to the Rayleigh scattering of the incident laser radiation and a number of weaker bands with wavenumbers, \( {\overset{\sim }{\nu}}_1\pm {\overset{\sim }{\nu}}_{osc} \):\( {\overset{\sim }{\nu}}_{osc} \) =218, 314, 459, 762 and 790 cm −1 。 The Stokes Raman lines are shown on the left-hand side of the plot (Fig. 5a); the anti-Stokes Raman lines are shown on the right. The \( {\overset{\sim }{\nu}}_{osc} \) values relate to the fundamental vibrations of the carbon tetrachloride molecule [1]. In the original work by Raman and Krishnan [220], the same spectrum was measured using mercury arc radiation (\( {\overset{\sim }{\nu}}_1 \) =22,938 cm −1 , 435.83 nm). In this seminal work, the anti-Stokes bands at \( {\overset{\sim }{\nu}}_1+762 \) and \( {\overset{\sim }{\nu}}_1+790 \) cm −1 were not observed. Hence, after the invention of the laser, Rayleigh and Raman scattering experiments are preferably performed using monochromatically intense lasers.

a Spontaneous Stokes and anti-Stokes Raman spectrum of carbon tetrachloride (liquid) excited by an argon ion laser, \( {\overset{\sim }{\nu}}_{\mathrm{p}}=20487 \) cm −1 。 The spectrum is presented according to recommendations of the International Union of Pure and Applied Chemistry. b i Raman spectra of thin multi-layer (nL) and bulk MoS2 films. The solid line for the 2 L spectrum is a double Voigt fit through data (circles for 2L, solid lines for the remainder). b ii Frequencies of \( {\mathrm{E}}_{2\mathrm{g}}^1 \) and A1g Raman modes (left vertical axis) and their difference (right vertical axis) as a function of the number of layers. b iii, iv spatial maps (23 μm × 10 μm) of Raman frequency of \( {\mathrm{E}}_{2\mathrm{g}}^1 \) (iii) and A1g (iv) from a sample of thin MoS2 films deposited on a SiO2 / Si基板。 b v Atomic displacements of the four Raman-active modes and one infrared-active mode (E1u ) in the unit cell of the bulk MoS2 crystal as viewed along the [1000] direction. c Microscopic image of nebulised ammonium sulphate aerosol particles on:i, Klarite; iii, silicon wafer. ii, iv Raman mapping image of sample (i) and (iii), respectively. d i Pseudo colour broadband CARS image of tumour and normal brain tissue, with nuclei highlighted in blue, lipid content in red and red blood cells in green. d ii Broadband CARS image and axial scan (below) with nuclei highlighted in blue and lipid content in red. d iii Broadband CARS image with nuclei highlighted in blue, lipid content in red and CH3 stretch–CH2 stretch in green. NB, normal brain; T, tumour cells; RBC, red blood cells; L, lipid bodies; WM, white matter. d iv Single-pixel spectra. e Raman thermography measurements across the active region of a high electron mobility transistor on SiC substrate with both E2 and A1 (LO) phonons considered to compensate for thermal stress. Device temperature rise determined using either E2 or A1 (LO) phonon mode alone (neglecting thermal stress) is shown in the top left insert. f (left) illustration of the manipulation of a straight isolated carbon nanotube (CNT) lying on a glass substrate by the sharp apex of an AFM tip. f (right) two-dimensional image of a CNT constructed by colour-coding the frequency position of the G+ vibrational mode in TERS spectra. The colour variation shows the strain distribution along the CNT at high-spatial resolution. a reproduced with permissions from [1]. b Adapted with permission from [217]. c Reprinted with permission from [96]. d Reprinted by permission from [167]. e Reprinted from [218]. f Reprinted by permission from [219].
Layered Two-Dimensional Systems
Raman spectroscopy can be used to determine the layer thickness in two-dimensional materials with atomic level precision, using either the inter-layer or intra-layer vibrational modes [19]. Lee etal。 [12] demonstrated the technique with two intra-layer Raman modes of molybdenum disulphide (MoS2 )。 Figure 5b shows representative Raman spectra for single- and few-layer MoS2 サンプル。 Among the four Raman-active modes of bulk 2H phase MoS2 crystal (shown in Fig. 5b v), Lee et al. [12] only observed the \( {E}_{2g}^1 \) and A 1 g modes near \( \Delta \overset{\sim }{\nu } \) =400 cm −1 。 The authors surmised that the other modes were not observed either because of the selection rules for the scattering geometry (E 1 g ) [217] or because of the limited rejection of the Rayleigh scattering radiation (\( {E}_{2g}^2 \)) [13]. The authors [12] report that single-layer MoS2 exhibits a strong in-plane vibrational mode at \( \Delta \overset{\sim }{\nu } \) ~ 384 cm −1 , corresponding to the \( {E}_{2g}^1 \) mode of the bulk 2H-MoS2 結晶。 For all film thickness, the Raman spectra in Fig. 5b i show strong in-plane \( {E}_{2g}^1 \) and out-of-plane A 1 g vibration signals. As the sample thickness increases (Fig. 5b i and ii), the \( {E}_{2g}^1 \) mode red shifts and the A 1 g mode blue shifts. For films of four of more layers, the \( {E}_{2g}^1 \) and A 1 g modes converge on the bulk values. Spatial maps of a MoS2 film sample for the \( {E}_{2g}^1 \) mode is shown in Fig. 5b iii; that of the A 1 g mode is shown in Fig. 5b iv. These maps demonstrate that the frequency of the two modes only slightly vary in regions of the sample with a given layer thickness. Hence, Raman spectra can provide a convenient and reliable means of determining the layer thickness in two-dimensional crystalline materials with atomic level precision.
Enhanced Raman Scattering Through SERS
Ault et al. [221] were the first to use SERS to enhance the Raman scattering signal of previously undetectable secondary organic aerosol particles on Ag nanoparticle-coated quartz substrates. Fu et al. [96] demonstrated enhancement factors of 6 for the Raman spectra of ammonium sulphate (AS) at the Raman active mode \( {\overset{\sim }{\nu}}_{\mathrm{s}} \)(SO4 2- ) at 970 cm −1 with Klarite. Figure 5c shows a microscope image of a large AS particle on the surface of Klarite (Fig. 5c i), the corresponding Raman mapping image is in Fig. 5c ii. Figure 5c iii shows another sample of AS particle but on a silicon wafer. The corresponding Raman mapping image is shown in Fig. 5c iv. Aside from the three larger AS particles, small (sub-micron) AS particles are apparent in Fig. 5c iii. However, in the absence of SERS, these smaller particles are undetectable. On the other hand, the SERS Raman mapping image (Fig. 5c ii) shows a vastly enhanced signal intensity, as is evident from the scale bars, to the point where a number of small spots yield a signal at the \( {\overset{\sim }{\nu}}_{\mathrm{s}} \)(SO4 2- ) Raman mode. Such spots most likely correspond to small AS particles that are observable in Fig. 5c ii but are not apparent in Fig. 5c i.
Insights into Cellular Structure with CARS
CARS microscopy is relevant to the chemical [64, 222,223,224,225], materials [78, 226, 227], biological and medical fields [29, 36, 61, 63, 167, 228] and can provide unparalleled insights into cellular structures [53]. Spontaneous Raman and infrared micro/spectroscopy can provide adequate chemical specificity and sensitivity to delineate a variety of neoplasms [229,230,231,232,233,234,235,236,237] but require long integration times and have a coarse spatial resolution, which may limit accurate tumour-boundary identification and early-stage tumour detection. However, coherent Raman imaging techniques have demonstrated high-speed, high-spatial-resolution imaging, but with contrast limited to single or few Raman peaks [36, 53, 167, 232]. Figure 5d presents images of orthotopic xenograft brain tumours from within a murine brain [167]. Figure 5d i shows a broadband CARS image with nuclei in blue (\( \Delta \overset{\sim }{\nu } \) =730 cm −1 ), lipid content in red (\( \Delta \overset{\sim }{\nu } \) =2850 cm −1 ) and red blood cells in green (\( \Delta \overset{\sim }{\nu } \) =1548 cm −1 + 1565 cm −1 :C-C stretch from haemoglobin [238]). The large tumour mass and a projection of neoplastic cells within healthy tissue are clearly shown (Fig. 5d i). Figure 5 ii shows several small regions of main tumour mass migrating into the healthy brain matter. Figure 5 iii shows the boundary between normal brain tissue, white matter and tumour masses, which contrasts lipids in red (\( \Delta \overset{\sim }{\nu } \) =2850 cm −1 ); CH 3 stretch-CH2 stretch (\( \Delta \overset{\sim }{\nu } \) =2944 − 2850 cm −1 ), a general contrast; and nuclei in blue (\( \Delta \overset{\sim }{\nu } \) =785 cm −1 )。 The image shows the fibrous texture of the white matter and strands of myelination around cancer cell clusters. Figure 5d iv presents a set of single-pixel spectra from an intra-tumoural nucleus, the white matter and normal brain, respectively. The spectra indicate that lipids are most concentrated in the white matter and least in the tumour regions.
Raman Thermography
Advances in electronic and opto-electronic semiconductor devices, such as high electron mobility transistors (HEMTs), have led to thermal management challenges [65]. Conventional thermal characterisation approaches such as infrared thermography are often no longer applicable for the accurate characterisation of high-power density devices due to limited spatial resolution which can result in the underestimation of the device peak temperature [239]. Batten et al. [218] have demonstrated temperature profiling in AlGaN/GaN HEMTs using Raman thermography by exploiting the E2 and A1 (LO) phonon modes. Both the E2 and A1 (LO) modes shift to lower frequency when operating the device. Figure 5e shows a comparison of the temperature rise in a AlGaN/GaN HEMT on a SiC substrate from Raman thermography and thermal simulations. The device was operated at a source-drain voltage of 40 V and a power density of 25 W/mm and had a thermal resistance of 8 °C/(W/mm).
Measuring Strain on the Nanoscale Using TERS
TERS microscopy is an effective means of imaging nanostructures beyond the spatial resolution of the so-called light diffraction limit [152,153,154, 219]. Nanostructures such as DNA molecules [240], carbon nanotubes (CNTs) [241, 242], silicon devices [101, 243], dye molecules [244] and single molecules [83] can be imaged using TERS. The technique can even be used to measure the local molecular strain in nanostructured materials. For example, AFM can be used to manipulate CNTs with nanoscale precision to develop a local strain [245,246,247,3.0.CO;2-O " href="/articles/10.1186/s11671-019-3039-2#ref-CR248" id="ref-link-section-d64193610e7320">248]. Figure 5f (left) illustrates the process of CNT manipulation using contact-mode AFM. Although local strain in CNTs has previously been studied using AFM and transmission electron microscopy [245], TERS microscopy is the only optical technique that can provide images of such local structural distribution of nanomaterials. When a straight CNT is deformed by manipulation, a local breakdown in symmetry is induced. This causes the selections rules of Raman scattering to become relaxed, allowing forbidden Raman modes to become visible in the vicinity of the local curvature [219]. The position of the characteristic G-mode Raman scattering line in graphene can be used to deduce local strain using TERS [249]. Figure 5f (right) shows a TERS image of a deformed CNT which has been constructed from the peak positions of the G + -mode [219]. The image has a spatial resolution better than 20 nm which is about 25 times finer than the diffraction limit of the excitation wavelength of light (488 nm). The colour variation (as indicated by the scale bar) corresponds to the local peak position of the G + -mode and represents the variation of strain along the CNT.
Recent Results
Stimulated Raman Scattering Microscopy
Unlike CARS, SRS microscopy does not contain a nonresonant background signal that degrades image contrast. However, SRS can be affected by cross-phase modulation (where light at one wavelength modulates the refractive index in the medium affecting another wavelength of light), transient-absorption (which is characteristic of femtosecond light pulses) and photo-thermal effects which can modify the vibrational energy levels and reduce hyperspectral image contrast [250,251,252]. SRS is quantified by the amount of energy transfer from the pump light to the Stokes light when the difference frequency between the pump and Stokes light matches a specific vibrational frequency, ω osc 。 In addition, the resulting signal from SRS is strongly sensitive to the incident polarisations when the orientation of the probed vibrating species is ordered. This polarisation dependence can be exploited to probe the orientational order of vibrational modes in samples. However, currently developed techniques are not able to perform large-field fast time scale dynamics instantaneously due to the requirement of point-wise scanning over the sample space. Conventional polarisation-resolved techniques take minutes because each point of the scanning area must be polarisation tuned sequentially [74, 80, 253, 254].
Multi-lamellar myelin plays a crucial role for efficient transmission of nerve impulses as an electrical insulator [255]. The lipids and proteins in myelin self-assemble into a highly ordered and stable structure to form a tightly packed membrane [256]. In neurological disorders, this compact structure is highly perturbed leading to dysfunctions of the central nervous system [257, 258]. As these biological processes are highly dynamic, researchers seek to observe the dynamics of molecular order with sufficient resolution and frame rate. Hofer et al. [259] have recently demonstrated fast-polar-SRS by exploiting high-speed amplitude- and polarisation modulation with an acousto-optic modulator (AOM) and electro-optical polarisation modulation, respectively, to read out the molecular order and orientation at a fast rate. They therefore obtain both amplitude and phase information. The authors report the ability to retrieve density maps of molecular bonds with the absolute value of molecular order. The linear polarisation direction of the pump beam is rapidly rotated while the Stokes polarisation is circularly polarised to avoid polarisation dependence from the Stokes beam. The polarisation is further modified by a quarter-wave plate. The polarisation modulation leads to an α -dependant response of the signal intensity given by the following:
$$ I\left(\alpha \right)\propto {a}_0+{S}_2\cos 2\left(\alpha -{\varphi}_2\right) $$ (14)ここでα is the rotating pump polarisation direction in the sample plane, a 0 is the total measured intensity, and S 2 and φ 2 are the amplitude and phase of the second-order induced modulation [259].
Figure 6a.i shows a comparison of conventional polarisation SRS with that from Hofer’s fast-polarisation SRS on a multi-lamellar lipid vesicle (MLV). The fast-polarisation SRS image in the bottom of Fig. 6a i was obtained in 1 s which is two orders of magnitude faster than the conventional-SRS image (top) using the same incident powers, number of pixels and dwell time per pixel. Figure 6a ii shows sub-second frame-rate imaging of a MLV using double EOM-AOM modulation SRS at two instances in time. The measurement technique was remarked to have little effect on the lipid order properties during the measurement. Hofer et al.[259] were able to observe second-timescale dynamics in thin lipid membranes down to the cell plasma membrane using fast-polarisation-resolved SRS as shown in Fig. 6a iii.

a Comparison of conventional and fast-polarisation SRS on multi-lamellar lipid vesicles (MLVs). a i–iii the composite images show absolute local molecular order (S2 ) and mean molecular orientation (φ 2 ) values represented as coloured sticks. a i (top) Conventional polarisation SRS on a MLV using step angles of 5° (acquisition time 112 s); the total measured intensity (a 0 ) is represented as a grey-scaled background. a i (bottom), fast-polarisation SRS on the same MLV (acquisition time 1 s); the acousto-optic modulation (AOM) is shown as a grey-scaled background. a ii Fast-polarisation dynamics SRS images of lipid order in a MLV taken at different times of the observation sequence shown; the AOM is shown as a grey-scaled background. Zoomed regions at the upper part of the MLV contour show no change in lipid order during the measurement over tens of seconds. a iii Fast-polarisation dynamics of lipid order in a thin lipid membrane. Coloured sticks show S 2 and φ 2 and the grey-scale background shows the AOM amplitude. b i SRS flow cytometry (SRS-FC) setup. b ii Colour-coded constrained principle component analysis (CPCA) scatter plot of SRS-FC spectra from mixed PMMA (red), PS (blue) and PCL (green) beads. The principle components (PC 1 and PC 2) are distinguished subpopulations of mixed polymer beads according to the distinct Raman spectra. Data were acquired in 6 s using a bead mixture with a concentration of 2% solids. The beads were 10 μm in diameter. b iii (left) Colour-coded CPCA scatter plot from SRS-FC analysis of lipid amount in 3T3-L1 cells with principle components differentiated through quantification of distinct chemical compositions inside single cells. Data were acquired in 3 s. b iii (right) SRS images of the two 3T3-L1 cell types. c i Illustration of the generation and amplification of a new orbital angular momentum (OAM) laser in a configuration with no initial OAM using a Hermite-Gaussian (TEM) laser. c ii, iii Simulation of the generation and amplification of a new OAM mode from initial configurations with no net OAM. c ii The initial seed TEM modes in x -および y -directions (top and bottom, respectively). c iii The new OAM mode electric field components at z =3.5 mm in x -および y -directions (top and bottom, respectively). The new mode is linearly polarised in the x -および y -directions with l 1x = l 1y = − 1 from an initial seed polarised in the x -direction with a TEM01 mode and in the y -direction with a TEM10 mode that is π /2 out of phase with respect to the TEM01 mode polarised in x 。 The pump is a Gaussian laser polarised at 45°. Projections in the (x,y) plane (blue-white-red) show the normalised vector potential (ϕ0) field envelope of the new OAM mode at the longitudinal slice where the laser intensity is maximum. The envelope of the 3D laser intensity is also shown in blue-green-red colours and normalised vector potential isosurfaces in blue and red. The values of the laser vector potential illustrated by the isosurfaces are shown in c (ii) and c (iii). a reproduced with permission from the OSA [259]. b reproduced with permission from the OSA [260]. c Adapted from [46] and licenced under CC BY 4.0.
Flow cytometry (FC) is one of the most important technologies for high-throughput single-cell analysis. FC is a technique used to measure physical/chemical characteristics of a population of cells or particles suspended in a fluid [59, 261]. The fluid suspension flows through the instrument detectors for fluorescent labelling which is the primary approach for cellular analysis in FC. Figure 6b i shows an optical FC setup [260]. However, for small molecules, the fluorescent tags can perturb the biological function of the species. In addition, non-specific binding of fluorescent labels as well as cellular autofluorescence can also reduce the clarity of the result. SRS flow cytometry (SRS-FC) non-invasively detects chemical cell content but conventional techniques suffer slow acquisition rates.
張ら。 [260] have recently demonstrated label-free high-throughput single-particle SRS-FC with a 32-channel multiplexing technique. Their technique measured single-particle chemistry at a rate of 5 μs per SRS spectrum, approaching that of standard fluorescence-based FC. The SRS-FC technique was based on broadband laser excitation and a multiplex spectral detection system. The systems allowed the acquisition of 200,000 spectra per second, more than 11,000 particles per second. The subpopulations of species, such as mixed polymer beads and 3T3-L1 cells, could be separated and distinguished through compositional principle component analysis (CPCA) of the SRS signals. The principle components were designated according to their Raman spectra. An agglomerative clustering procedure was performed on the resulting CPCA spectral matrix. This procedure assumed the number of cluster groups (κ ) was known to separate the clusters of principle components in the CPCA analysis. Figure 6b ii shows the CPCA of the SRS spectra for a mixture of three types of beads:poly-methyl-methacrylate (PMMA), polystyrene (PS) and polycaprolactone (PCL), all with a 10-μm mean diameter, mixed at a 2:1:1 ratio of PMMA:PS:PCL and a final concentration of 2% solids in the fluid. The flow speed was ≈ 0.16 ms −1 , the SRS-FC data was acquired in 6 s. The CPCA plot (Fig. 6b ii) shows three distinct clusters of principle components. The agglomerative clustering procedure (κ =3) allowed the quantification of ~ 7100 PMMA bead (red), ~ 3400 PS beads (blue) and ~ 3600 PCL beads (green) as shown in Fig. 6b ii. Their measurement demonstrated the ratio of ≈ 2:1:1 (PMMA:PS:PCL) at a throughput rate of ~ 2350 particles per second and that their multiplex SRS-FC system, paired with the CPCA analysis, could distinguish different chemical components with small spectral differences.張ら。 [260] were able to detect beads as small as 1 μm and were even able to detect single Staphylococcus aureus bacteria flowing through the laser focus highlighting the potential to characterise subcellular organelles with SRS-FC.
張ら。 [260] also demonstrated the discrimination of 3T3-L1 cells at different stages of cell differentiation according to their difference in lipid amount using SRS-FC. After insulin-induced differentiation, 3T3-L1 cells acquire an adipocyte-like phenotype with a significantly increased amount of triglycerides which aggregate to form large lipid droplets. This aggregation of triglycerides causes the intensity of the methylene symmetric vibration at \( \Delta \overset{\sim }{\nu } \) =2850 cm −1 from fatty-acid acyl chains to become stronger compared to that of non-differentiated cells which provides the means for CPCA analysis. Figure 6b iii shows the CPCA scatter plot of the cell mixture measured by Zhang et al. [260] which were separated using the agglomerative clustering approach. The insert SRS images (Fig. 6b iii, right) show a non-differentiated 3T3-L1 cell and a differentiated cell with the formation of large lipid droplets.
Twisted Laguerre-Gaussian lasers, with orbital angular momentum (OAM) and characterised by doughnut-shaped intensity profiles, are of great interest to a number of growing research fields such as ultra-cold atoms [262,263,264], microscopy and imaging [265, 266], atomic and nanoparticle manipulation [267, 268], ultra-fast optical communication [269, 270], quantum computing [271], astrophysics [272] and plasma accelerators [47]. Spiral phase plates or computer-generated holograms are usually used to generate visible light with OAM [273,274,275,276]. Spiral phase plates can produce light with predefined OAM modes. By using plasma as an optical medium to generate and amplify laser pulses with OAM and relativistic intensities, well above the damage threshold of optical devices, could provide for high-energy-density science and applications. Plasmas also allow for greater flexibility in the level of OAM in the output laser beam than conventional optics. Vieira et al. [46] have shown that SRS in nonlinear optical media with Kerr nonlinearity (e.g. plasmas, optical fibres and nonlinear optical crystals) can be used to generate and amplify OAM light. The authors show that it is possible to generate and amplify light with OAM when no net OAM is initially present. Figure 6a i illustrates the process in which the pump EM fields can have different OAM components in both transverse directions x および y (blue and orange in Fig. 6a i). l 0x is the pump electric field component of OAM in the x 方向。 Likewise, l 0y is the pump electric field component of OAM in the y 方向。 The initial seed electric field component has an OAM component l 1x 。 After interacting with the plasma, the pump is depleted, and a new electric field component appears in the seed with OAM l 1y = l 1x + l 0x − l 0y 。
The authors [46] use an analytical theory for arbitrary transverse laser field envelope profiles and particle-in-cell simulations for plasma. Stimulated Raman backscattering in plasma is a three-wave mode coupling process in which a pump pulse decays into an electrostatic (Langmuir) plasma wave as well as a counter-propagating seed laser. The plasma can be viewed as a high-intensity mode converter. The presence of OAM in the pump and/or seed results in additional matching conditions that ensure the conservation of angular momentum of the pump when the pump decays into a scattered electro-magnetic wave and a Langmuir wave [40].
Particular superpositions of Hermite-Gaussian modes TEM modes are mathematically equivalent to Laguerre-Gaussian modes [277]. Vieira et al. [46] therefore explore the use of Stimulated Raman backscattering to generate and amplify light with OAM using TEM laser beams with no initial net OAM. Each Hermite-Gaussian beam in the simulation is described by TEMm 、 n , where m および n represent the Hermite-Gaussian mode index. Figure 6c ii and iii show the 3D simulation results from the setup shown in Fig. 6c i. The simulations show that SRS results in a new OAM mode with l 1 = 1 linearly polarised at 45°. The field topology of the seed normalised vector potential changes from plane isosurfaces in Fig. 6c ii, to helical isosurfaces in (Fig. 6c iii). Hence, light with OAM has been generated from light with no net OAM. The authors [46] note that their results could be extended to other nonlinear optical media with Kerr nonlinearity. In the case of plasma, the interaction between the seed light and the pump light occurs via an electron Langmuir wave. This interaction ensures that the frequency, wavenumber and OAM matching conditions are conserved.
Coherent Anti-Stokes Raman Scattering Microscopy
CARS results from an induced anti-Stokes scattering of radiation, ω AS , which is enhanced when ω p − ω S =ω OSC 。 One of the main challenges with CARS microscopy is the nonresonant background. The existence of the nonresonant background can either distort or even saturate the resonant signal of Raman peaks, which reduces the image contrast.秦ら。 [278] have recently demonstrated multi-colour background-free coherent anti-Stokes Raman scattering microscopy using an all-fibre, low-cost, multi-wavelength time lens source. A time lens, in analogy to a spatial lens, is simply a quadratic optical phase modulator in time, which can be approximated by a portion of a sinusoidal phase modulator [279,280,281]. Three different wavelength picosecond pulse trains were provided by the time lens source, at 1064.3 nm (stable), 1052–1055 nm (tuneable) and 1040–1050 nm (tuneable). The time lens was used to apply temporal quadratic phase modulation to a continuous-wave laser to broaden its spectral bandwidth [279, 282,283,284,285,286,287,288]. In this instance, the time lens was applied with fibre-integrated electro-optic radio-frequency phase modulators. The phase modulation and pulse synchronisation were derived from a mode-locked Ti:Sapphire laser that provided synchronised multi-colour picosecond pulses with dispersion compensation. Electronic tuning of the pulse delay was used to achieve temporal overlap between the pump and Stokes laser pulse trains, which is a convenient substitution for mechanical optical delay paths. Two of the three wavelengths of light from the time lens source were used for two-colour on-resonance imaging and the third wavelength for off-resonance (nonresonant background subtraction) imaging. Pixel-to-pixel wavelength switching was achieved, which provided simultaneous two-colour CARS imaging with real-time nonresonant background subtraction.秦ら。 [278] demonstrated the technique with an excised fresh tissue sample from a mouse ear and imaged molecular stretching vibrations at 2845 cm −1 (CH 2 ) and 2940 cm −1 (CH3 ) and non-resonance background at \( \Delta \overset{\sim }{\nu } \) =2770 cm −1 。 Figure 7a i–iii shows the process applied to the Raman peak of CH3 stretching vibration from the mouse ear tissue sample.

a Simultaneous two-colour CARS imaging with real-time nonresonant background subtraction from a mouse tissue sample at a surface depth of 45 μm. a i CARS image acquired at 2940 cm −1 (CH3 stretching vibration). a ii Off-resonance background CARS image at 2770 cm −1 。 a iii Background-free image of (i) at 2940 cm-1 after subtraction of the nonresonant background (ii). b Multi-lamellar lipid vesicle (MLV) imaged with conventional (i) and symmetry-resolved CARS (SR-CARS) at 1133 cm-1 (ii) and (iii). ii The incident circularly polarised pump, Stokes, probe and anti-Stokes light have co-rotating handedness (m F = 0). iii the incident circularly polarised pump, probe and anti-Stokes light have co-rotating handedness and the Stokes light has counter rotating handedness (m F = 2). c High-speed polarisation-resolved CARS image sequence on a MLV moving over the sample surface taken at different times of the observation sequence shown as a composite image of S 2 and φ 2 as coloured sticks and with the acousto-optic modulation (AOM) as a grey background. a reproduced with permission from the OSA [278]. b Adapted from [289] and licenced under CC BY 4.0. c reproduced with permission from the OSA [259].
The nonresonant background signal in CARS can also be suppressed by applying an external static electric field to the sample known as electro-CARS. Capitaine et al. [120] demonstrate this electro-optical technique on n-alkanes in solution with broadband multiplex coherent anti-Stokes Raman scattering spectroscopy. The nonresonant background is suppressed due to the orientation response of the molecules to the electric field. The molecular orientation is related to the induced electric dipole moment. The enhancement of the CARS signal-to-noise ratio was achieved in the case of the CH2 およびCH 3 symmetric/asymmetric stretching vibrational modes.
Conventional CARS provides information about the chemical nature but not about the molecular organisation or symmetry in the system. The Cartesian components of the nonlinear susceptibility tensor χ (3) represent the vibrational symmetry properties of the material [290, 291]. These tensor elements can be extracted with polarisation-resolved coherent Raman scattering schemes [72, 74, 169, 259, 292,293,294,295]. However, these schemes often involve the acquisition of multiple images from different polarisation angles requiring long acquisition times due to limits imposed by polarisation tuning [259] and time-consuming post-processing [67].
Cleff et al. [289] have recently demonstrated a label-free microscopy technique that uses circularly polarised light to probe the symmetry as well as the chemical fingerprint of the probed sample in a single acquisition. This symmetry-resolved CARS (SR-CARS) depends on both the presence of (ro-)vibrational modes as well as their local organisation. By switching between combinations of left- and right-handed circular polarisation states for the involved fields, the individual symmetry contributions of the sample can be imaged. This technique offers a straightforward means to access the local organisation of (ro-)vibrational bonds with improved image contrasts (with 1 to 2 orders of magnitude) for anisotropic samples, as well as improved chemical selectivity without post-processing and independently of sample orientation in the transverse plane. In addition, SR-CARS provides higher chemical selectivity with the contrast in symmetry characteristics, which are not accessible with conventional spontaneous Raman or SRS microscopy.
Multi-lamellar lipid vesicles (MLVs) are made of a tight packing of lipid layers forming a ring of highly ordered matter with twofold symmetry and a lipid orientation distribution close to a Gaussian angular shape [74].
Figure 7b i shows a conventional CARS image of an aqueous MLV at \( \Delta \overset{\sim }{\nu } \) =1133 cm −1 (C-C stretching vibration) which illustrates the expected poor contrast due to the nonresonant background [289]. Figure 7b ii and iii show the zeroth and second-order \( {m}_{\overline{F}} \)-value image of the same MLV as in Fig. 7b ii. The \( {m}_{\overline{F}} \)-value is the summation of the light circular polarisation handedness quantum numbers of the incident light beams:
$$ {m}_{\overline{F}}={m}_{\mathrm{p}}-{m}_{\mathrm{s}}+{m}_{\mathrm{p}\mathrm{r}}-{m}_{\mathrm{as}} $$ (15)When light with field tensor \( \overline{F} \) probes matter with nonlinear susceptibility tensor χ (3) , in a CARS process, the light probes only the parts of the matter with identical rotational invariant symmetries (i.e. identical \( {m}_{\overline{F}} \)). Hence, by engineering the field tensor of the light, specific sample symmetries can be directly read out, creating a symmetry-based image contrast mechanism [289]. The aqueous solution surrounding the MLV is only visible in the \( {m}_{\overline{F}}=0 \) image (Fig. 7b ii) due to its purely isotropic nature. Background-free imaging of the MLV with superior contrast with respect to conventional CARS is shown in Fig. 7b iii at \( {m}_{\overline{F}}=2 \), which results from the symmetric microscopic organisation of the lipids in the MLV. Imaging at \( {m}_{\overline{F}}=4 \) (not shown) lacked sufficient signal strength to provide an image of the MLV due to the lack of anti-symmetry in the lipid organisation.
As with SRS, the CARS signal is sensitive to the polarisation of the incident light when the orientation of the scattering species is ordered. Polarisation-resolved CARS (PR-CARS) requires monitoring of the CARS signal response depending on the relative rotation of the incident light polarisations (pump and Stokes) to the sample, in species with ordered orientations. Provided that the molecular bonds are oriented, the detected intensity of the anti-Stokes signal is maximised when the incident polarisations lie along the averaged direction of the bonds. The ability to monitor lipid order without the need for fluorescent labels can provide information on lipid packing properties. As mentioned, PR-CARS schemes often involve long acquisition times due to limits imposed by polarisation tuning and time-consuming post-processing.
In addition to fast-polar-SRS, Hofer et al. [259] have recently demonstrated fast-polar-CARS imaging with combined electro-optic polarisation and acousto-optic amplitude modulations. Figure 7c shows fast-polarisation CARS with similar sensitivity to that of SRS (shown in Fig. 6a). Despite the requirement of lock-in amplification for the detection of low modulation over a large nonresonant background, the fast-polarisation technique demonstrated by Hofer et al. [259] can considerably improve the signal-to-noise ratio in CARS imaging. Despite the robustness of MLVs, occasional alteration of molecular order in MLVs could be observed at the time scale accessible in Hofer’s experiment (0.25–1 s per image). MLVs could detach from the sample surface, inducing motion (Fig. 7c) or shape change. The modifications observed in Fig. 7c were attributed to a local membrane disruption, followed by its spontaneous reformation. Hofer et al. [259] demonstrated the possibility of visualising local modification during MLV displacement that was not accessible using the minute-time-scale conventional polarisation Raman experiments.
There have also been a number of developments in CARS flow cytometry (CARS-FC) [58, 296, 297]. However, these techniques were shown to be much slower than fluorescence-based FC. Out-of-focus microparticles can randomly impede CARS-FC and the fluid often generates a strong nonresonant background limiting CARS-FC from achieving high-throughput single-cell analysis. Recently, however, O’Dwyer et al. have demonstrated that it is possible to significantly enhance the fraction of unambiguously and instantly recognised in-focus microparticles, in unconstrained flows by co-monitoring CARS-FC with linear scattering of light.
CARS is invariably performed with two synchronised picosecond laser sources owing to the coherence life time of Raman resonance. Ti:Sapphire oscillators [168] or optical parametric oscillators pumped by a picosecond frequency-doubled Nd:Vanadate laser [53] are the instruments of choice, which are generally very expensive and the synchronisation mechanisms can be challenging. In addition, the spectral drift in the pump wavelength can introduce errors in the calculation of ω osc 。 Langbein et al. [124] have demonstrated CARS micro-spectroscopy using a single Ti:Sapphire laser oscillator and simple passive optical elements. Vibrational excitation, tuneable over a large spectral range with adjustable spectral resolution, was achieved by spectral selection with dichroic mirrors and linear chirping by glass elements.
Tip-Enhanced Dual Wavelength Coherent Anti-Stokes Raman Scattering Microscopy
TERS offers spatial resolution far beyond the diffraction limit of the probing light. The more conventional technique is to directly illuminate the tip-sample cavity [86]. This technique achieves the desired resolution (beyond the diffraction limit) by forcing the evanescent light into the far field image formation. However, the far field light presence in the tip-sample cavity generates an unfavourable background light source. It is possible to perform TERS by coupling the far-field excitation light to the tip a few tens of micrometres from the tip apex [298]. Femtosecond laser pulses can be coupled to the tip surface by shining the light on a grating fabricated on the tip surface. The SPPs then propagate to the tip apex and generate background-free localised optical excitation [210].
Toma et al. [298] previously demonstrated selective excitation of a single Raman mode and its CARS imaging of CNT using ultra-fast SPP pulse nanofocusing using an Au tapered tip. In a more recent publication, seminal work by Tomita et al. [155] demonstrated simultaneous nanofocusing of ultra-fast SPP pulses at 440 and 800 nm, which were coupled with a common diffraction grating structure. Figure 8a i, illustrates the scheme. The Al-tapered tip had an apex radius of ≈ 35 nm. Selective CARS microscopy that combined an 800 nm (ω ) SPP pump pulse and a 440-nm (2ω ) SPP probe pulse was achieved. Figure 8a ii illustrates the energy level process of ω - and 2ω -CARS. The pump pulse achieves selective vibrational excitation by spectral focusing [299,300,301,302]. Raman shift intensities with this 2ω-CARS scheme were reported to increase by as much as 4 compared with that of ω-CARS for monolayer graphene. The selectivity of vibration band excitation and background noise suppression were confirmed on the CARS intensity probed by a 2ω -SPP plasmon pulse for a monolayer graphene sample. Venezuela et al. [8] reported the Raman lines in graphene associated with both phonon-defect processes (such as the D line at \( \Delta \overset{\sim }{\nu } \) ~ 1350 cm −1 ) and two-photon processes (such as the 2D line). The 2D-band intensity in graphene was reduced monotonously when the defect concentration was increased, contrary to the D-band. Tomita et al. [155] applied their multi-vibrational-mode 2ω-CARS imaging method to a multi-walled CNT (MWCNT) at the D, G and 2D bands. This dual-wavelength nanofocusing technique could open new nanoscale micro-spectroscopy and optical excitation schemes in SPM, such as sum frequency mixing, two-photon excitation (ω +2ω ) and pump-probe schemes.

a i Illustration of tip-enhanced dual-wavelength nanofocused CARS on a multi-walled carbon nanotube (MWCNT). a ii Energy diagram for ω-CARS and 2ω-CARS. When the difference frequency between pump and Stokes light matches the vibrational mode of the molecule, it is resonantly excited. When ω and 2ω-probe light is simultaneously incident within the dephasing time, ω- and 2ω-CARS photons are respectively generated. b i Simultaneous topographical 2ω-CARS imaging of a MWCNT. b ii Composite image of three 2ω-CARS images of the MWCNT using the 2ω-CARS spectrum from D- (red), G- (blue) and 2D- (green) bands. Reprinted with permission from [155]
Figure 8b i shows a topography image of a MWCNT with a diameter of ~ 175 nm measured by the Al-tapered tip. Figure 8b ii shows a composite image of three 2ω-CARS images of the MWCNT using the 2ω-CARS spectrum from D- (red), G- (blue), and 2D- (green) bands. In ref. [155], the D- and 2D-band showed a negative correlation (in agreement with ref. [8]) except for the central part of the MWCNT. The 2D- and G-bands were intense near the central part of the MWCNT. Tomita et al. [155] indirectly estimated the spatial resolution of their technique to be less than 90 nm by taking the profile of the 2D-band signal across the axis of the MWCNT.
Conclusions
This review detailed the numerous applications of Raman spectroscopy and its advanced derivatives:stimulated Raman scattering, coherent anti-Stokes Raman scattering and surface- and tip-enhanced Raman spectroscopy. A description of the fundamental physics that underpins these techniques has been provided. Experimental considerations have been discussed with examples of typical instrumentation used. Examples of the analysis techniques employed to interpret the Raman spectroscopic data were presented and discussed.
The Raman effect now underpins prominent spectroscopic techniques in biology, medicine, crystallography and flow cytometry and has gained interest in plasma physics. It is employed as a non-invasive label-free chemically selective hyperspectral imaging technique with recent advances enabling the probing of molecular orientation and chemical composition. SRS and CARS are used to enrich signal detection at specified wavelengths associated with vibrational modes that are prescribed for spectral-selective imaging. Unlike SRS, CARS carries with it a nonresonant background contribution to the spectrum. This review detailed some of the efforts to suppress this unfavourable contribution.
Surface-enhanced Raman scattering is an ultrasensitive Raman technique that has enabled the detection of trace amounts of molecular species in samples that would otherwise be undetectable in spontaneous- or coherent Raman scattering techniques. The enhancement effect is largely associated with the plasmonic activity of the sample surface, which augments the light-matter interaction. This enhancement effect is optimised by tuning the plasmons associated wavelength with plasmonically active surface nanostructures.
Tip-enhanced Raman scattering spectroscopy is a relatively new technique that can capture hyperspectral images with spatial resolution beyond the diffraction limit of light. As light is fundamental to the Raman effect, the spatial resolution offered by TERS is so far unparalleled by other Raman scattering techniques. The surface plasmon wavelength can also be tuned for TERS techniques and recent advances have exploited surface plasmon polaritons to focus evanescent light at the tip apex with light coupled remotely from the tip apex. This technique has yielded enhanced the signal-to-noise ratio by removing the far-field light from the apex region. Recent advances have demonstrated this technique with dual-wavelength CARS.
データと資料の可用性
Not applicable
略語
- AFM:
-
原子間力顕微鏡
- AOM:
-
Acousto-optic modulator
- AS:
-
Ammonium sulphate
- CARS:
-
Coherent anti-Stokes Raman scattering
- CARS-FC:
-
CARS flow cytometry
- CNT:
-
カーボンナノチューブ
- CPCA:
-
Compositional principle component analysis
- CRS:
-
Coherent Raman scattering
- DBR:
-
Distributed Bragg reflection
- DFB:
-
分散フィードバック
- E-CARS:
-
Epi-scattered CARS
- EM:
-
Electro-magnetic
- FC:
-
Flow cytometry
- F-CARS:
-
Forward scattered CARS
- HEMTs:
-
High electron mobility transistors
- LSPR:
-
Local surface plasmon resonance
- MLV:
-
Multi-lamellar lipid vesicle
- MoS 2 :
-
Molybdenum disulphide
- MWCNT:
-
Multi-walled carbon nanotube
- NA:
-
Numerical aperture
- OAM:
-
Orbital angular momentum
- PCL:
-
ポリカプロラクトン
- PMMA:
-
Poly-methyl-methacrylate
- PR-CARS:
-
Polarisation-resolved CARS
- PS:
-
ポリスチレン
- SERS:
-
表面増強ラマン散乱
- SFM:
-
Shear force microscopy
- SLM:
-
Single-longitudinal mode
- SPM:
-
Scanning probe microscopy
- SPP:
-
表面プラズモンポラリトン
- SR-CARS:
-
Symmetry-resolved CARS
- SRS:
-
Stimulated Raman scattering
- STM:
-
走査型トンネル顕微鏡
- TEM:
-
Transverse electro-magnetic mode
- TERS:
-
Tip-enhanced Raman scattering
- VBG:
-
Volume Bragg-grating
ナノマテリアル