


IoT | TensorFlow WeatherStationは降雨強度を予測します
コンポーネントと消耗品
| × | 1 | ||||
 |
| × | 1 | |||
| × | 1 | ||||
 |
| × | 1 | |||
 |
| × | 1 | |||
 |
| × | 1 | |||
 |
| × | 2 |
必要なツールとマシン
>  |
|
アプリとオンラインサービス
>  |
| |||
 |
| |||
 |
|
このプロジェクトについて
特に2020年には、瞬間的な大雨と激しい降雨が、私の国の温室と収穫量に悪影響を及ぼしました。残念ながら、最近では予期せぬ過剰な降雨がより頻繁に発生し、一部の地域では気候変動のために比較的一般的になりました。一方、他の地域は干ばつに苦しんでいます。 2020年が過ぎると、私の地域では、豪雨による作物や家畜の損失を引き起こした35件以上の事件が記録されています。農業生産性の低下など、過度の降雨による問題を回避および回避するための解決策に貢献するために、私はこのプロジェクトを出発点として考えました。
このプロジェクトでは、主に農業への過度の降雨の影響に焦点を当てました。ただし、過度の降雨は、たとえば[1]:
のように多くの危険につながる可能性があります。- 人命へのリスクを含む洪水
- 建物やインフラストラクチャの損傷
- 作物と家畜の喪失
- 地滑りは、人命を脅かし、輸送や通信を妨害する可能性があります。
最新の研究で示されているように、過度の降雨は、直接的な物理的損傷、植え付けと収穫の遅れ、根の成長の制限、酸素欠乏、栄養素の損失など、さまざまな方法で作物の生産性に影響を与える可能性があります。したがって、雨が多すぎると農業にとって干ばつと同じくらい危険になる可能性があります。 "過去30年間のデータは、過度の降雨が過度の熱と干ばつと同じくらい作物収量に影響を与える可能性があることを示唆しています。イリノイ大学は、1981年から2016年までの作物保険、気候、土壌、およびトウモロコシの収量データを関連付けました。この調査では、数年の間に、過度の降雨により、米国のトウモロコシの収量が予想収量と比較して34%も減少したことがわかりました。干ばつと過度の熱により、数年間で最大37%の収量損失が発生しました[2] " 。
残念ながら、早期警報システムは、各温室または農場の適切で予備的な地域の気象データがなければ、農産物やプロセスに対する過度の降雨の悪化を完全に防ぐのに十分ではありません。そのため、過度の降雨による農業への悪影響を回避するために、このプロジェクトを予算にやさしい遠隔気象観測所として作成し、地域の気象情報を収集して解釈し、降雨強度をより正確に予測することにしました。
>深層学習とニューラルネットワークについて調査した後、分類モデルに基づいて人工ニューラルネットワーク(ANN)を構築し、蓄積された地域の気象データを解釈して、特定のクラスに従って降雨強度を予測することにしました。次の研究が示すように、研究者はさまざまなニューラルネットワークモデルとタイプを適用して、降雨だけでなく気象現象も予測しました。 "多くの実験では、ニューラルネットワークを使用して、さまざまな場所と先読み範囲での定量的な降雨量を予測しました。たとえば、タイの研究者は、フィードフォワードニューラルネットワークを使用して非常に正確な予測を取得し、1〜3時間の先読み範囲で定量的な降雨量を予測して、洪水の危険性を予測することができました。ニューラルネットワークは、予測にも使用されています。降雨の確率/量、風速、気圧などの従来の予測値に加えて、気象現象は竜巻の予測に非常にうまく使用されています。さらに、オーストラリアの研究者は、ニューラルネットワークを使用してさまざまな予測で霧を特定することに成功しました。キャンベラ国際空港周辺の範囲は3時間から18時間です[3]。 "
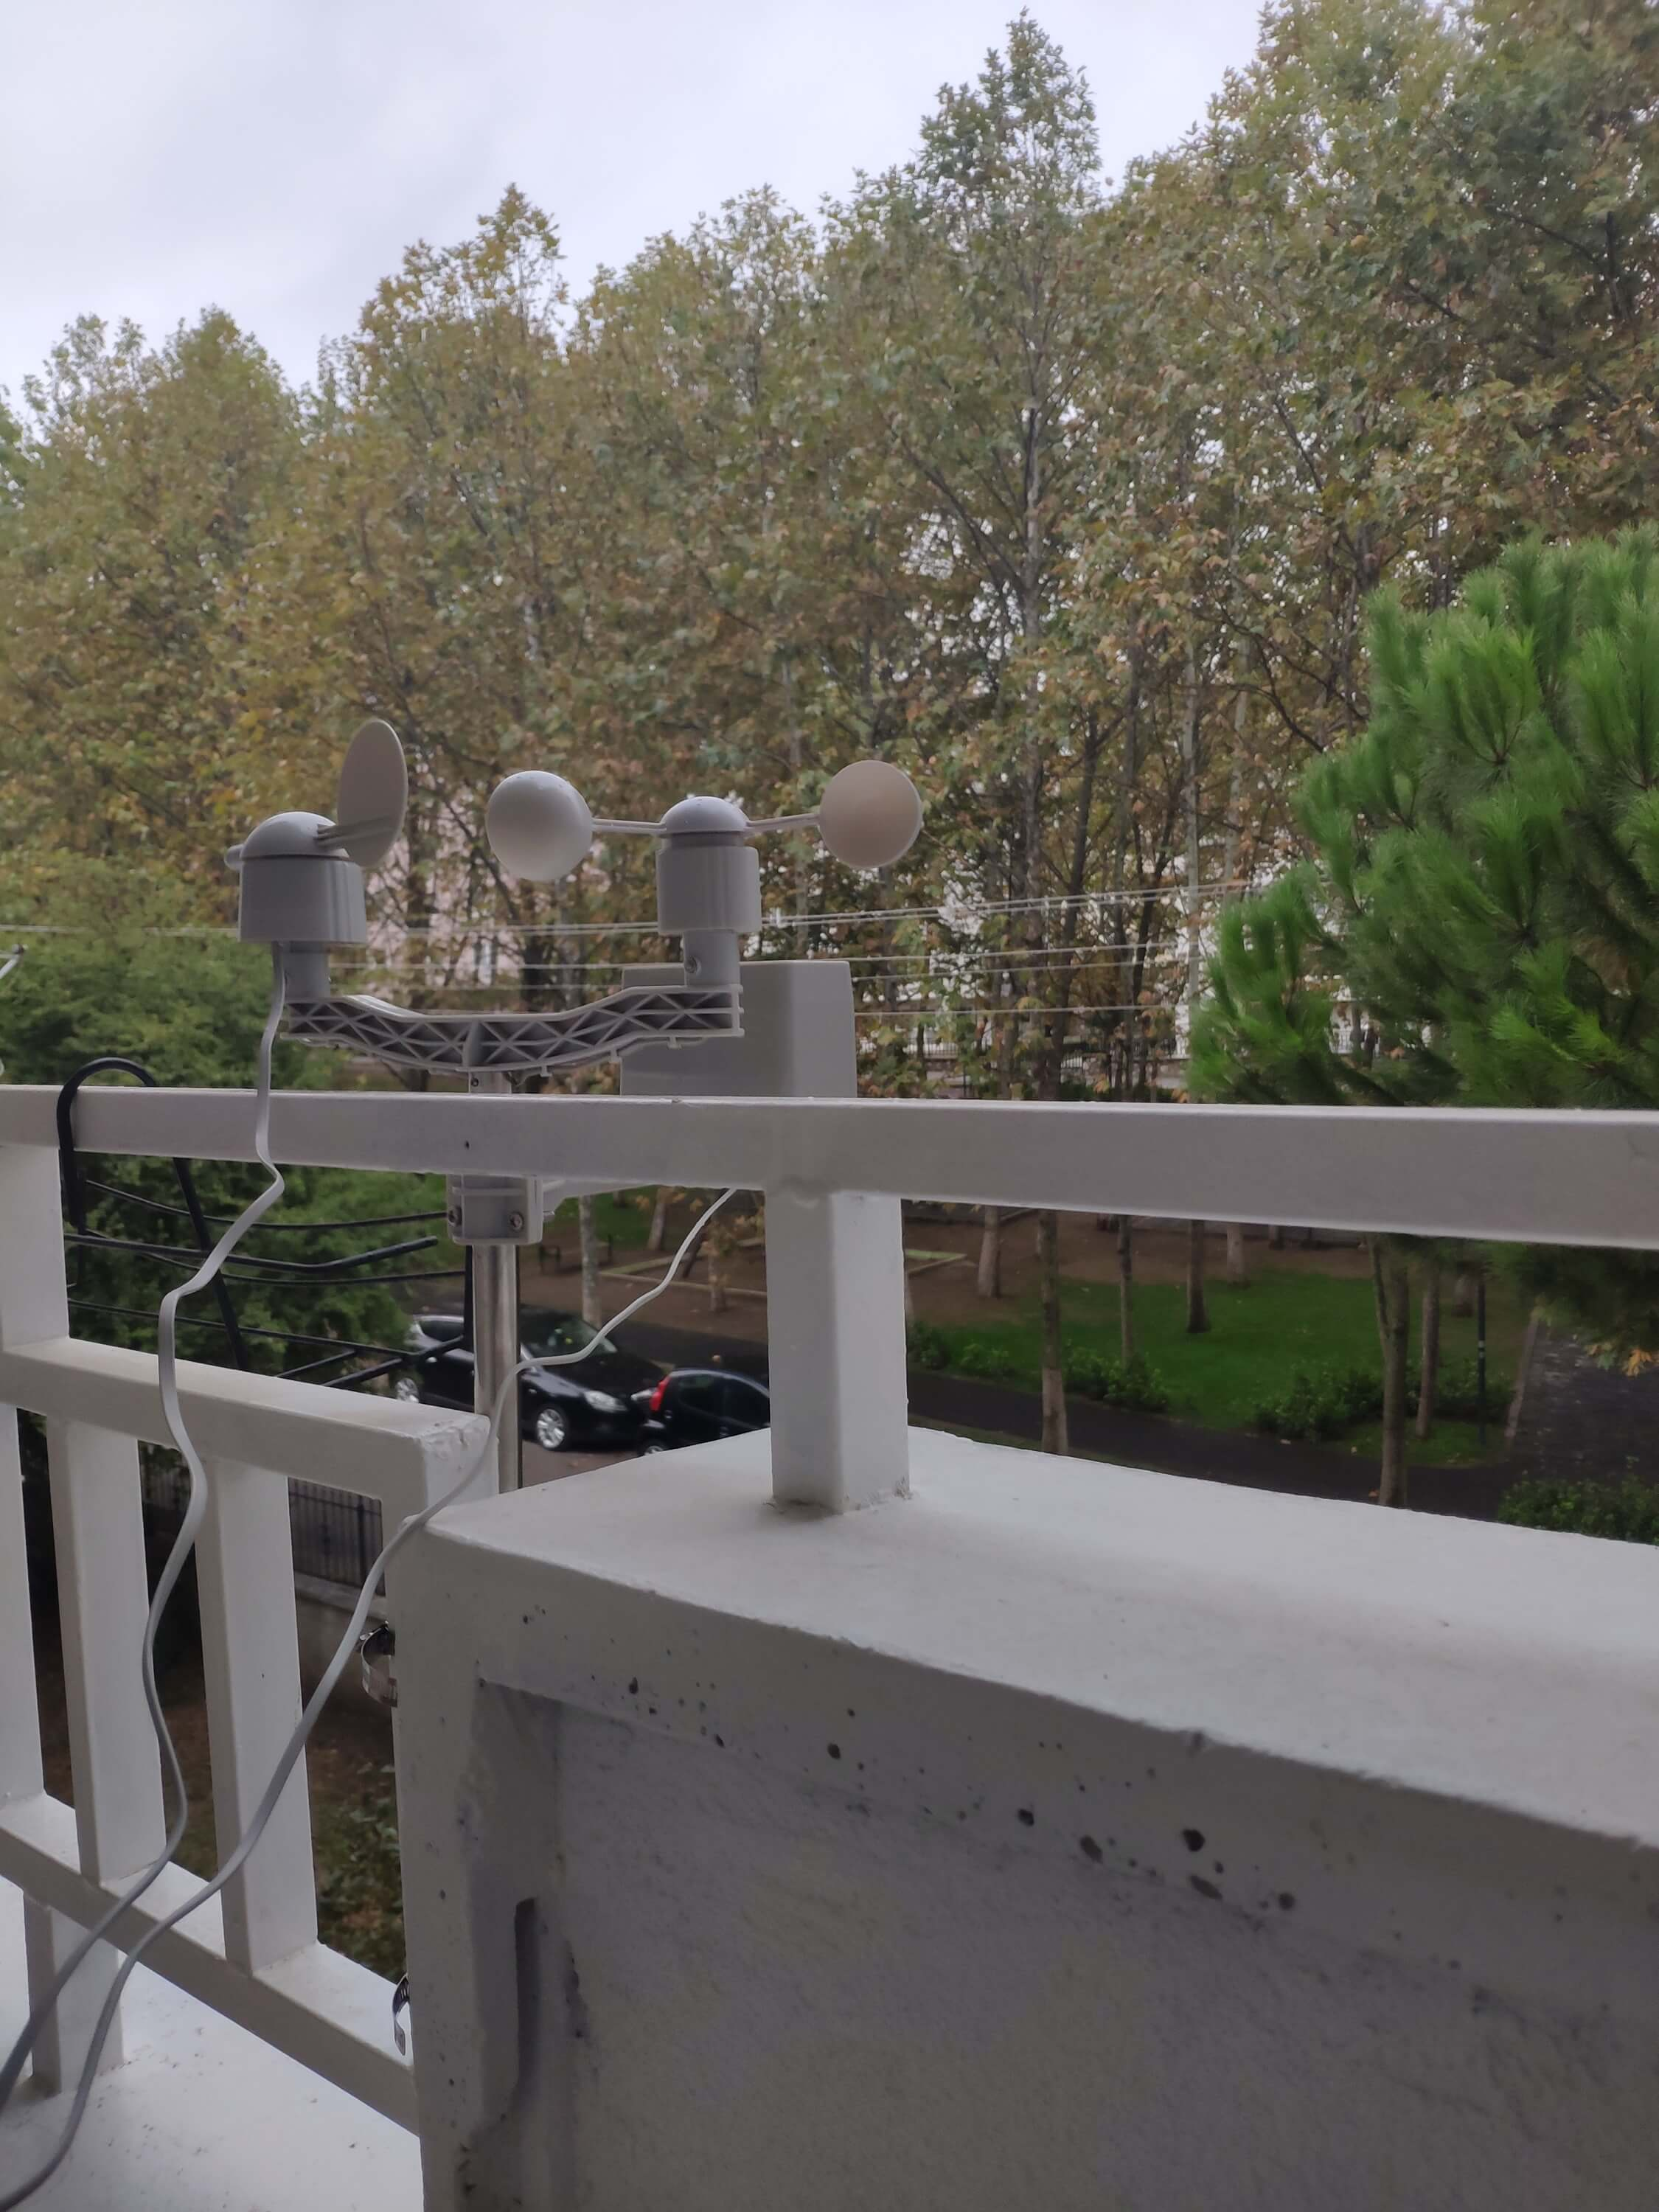
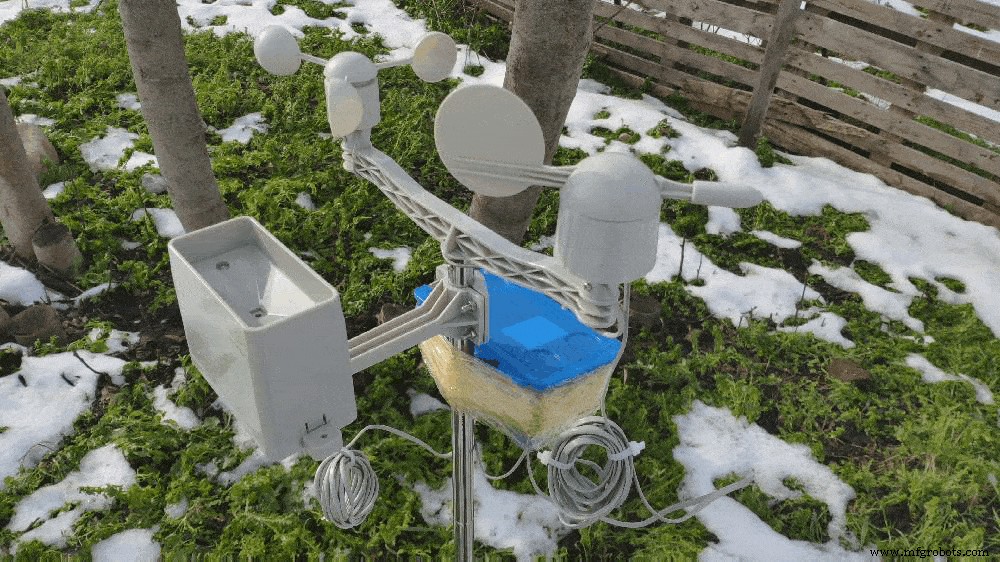
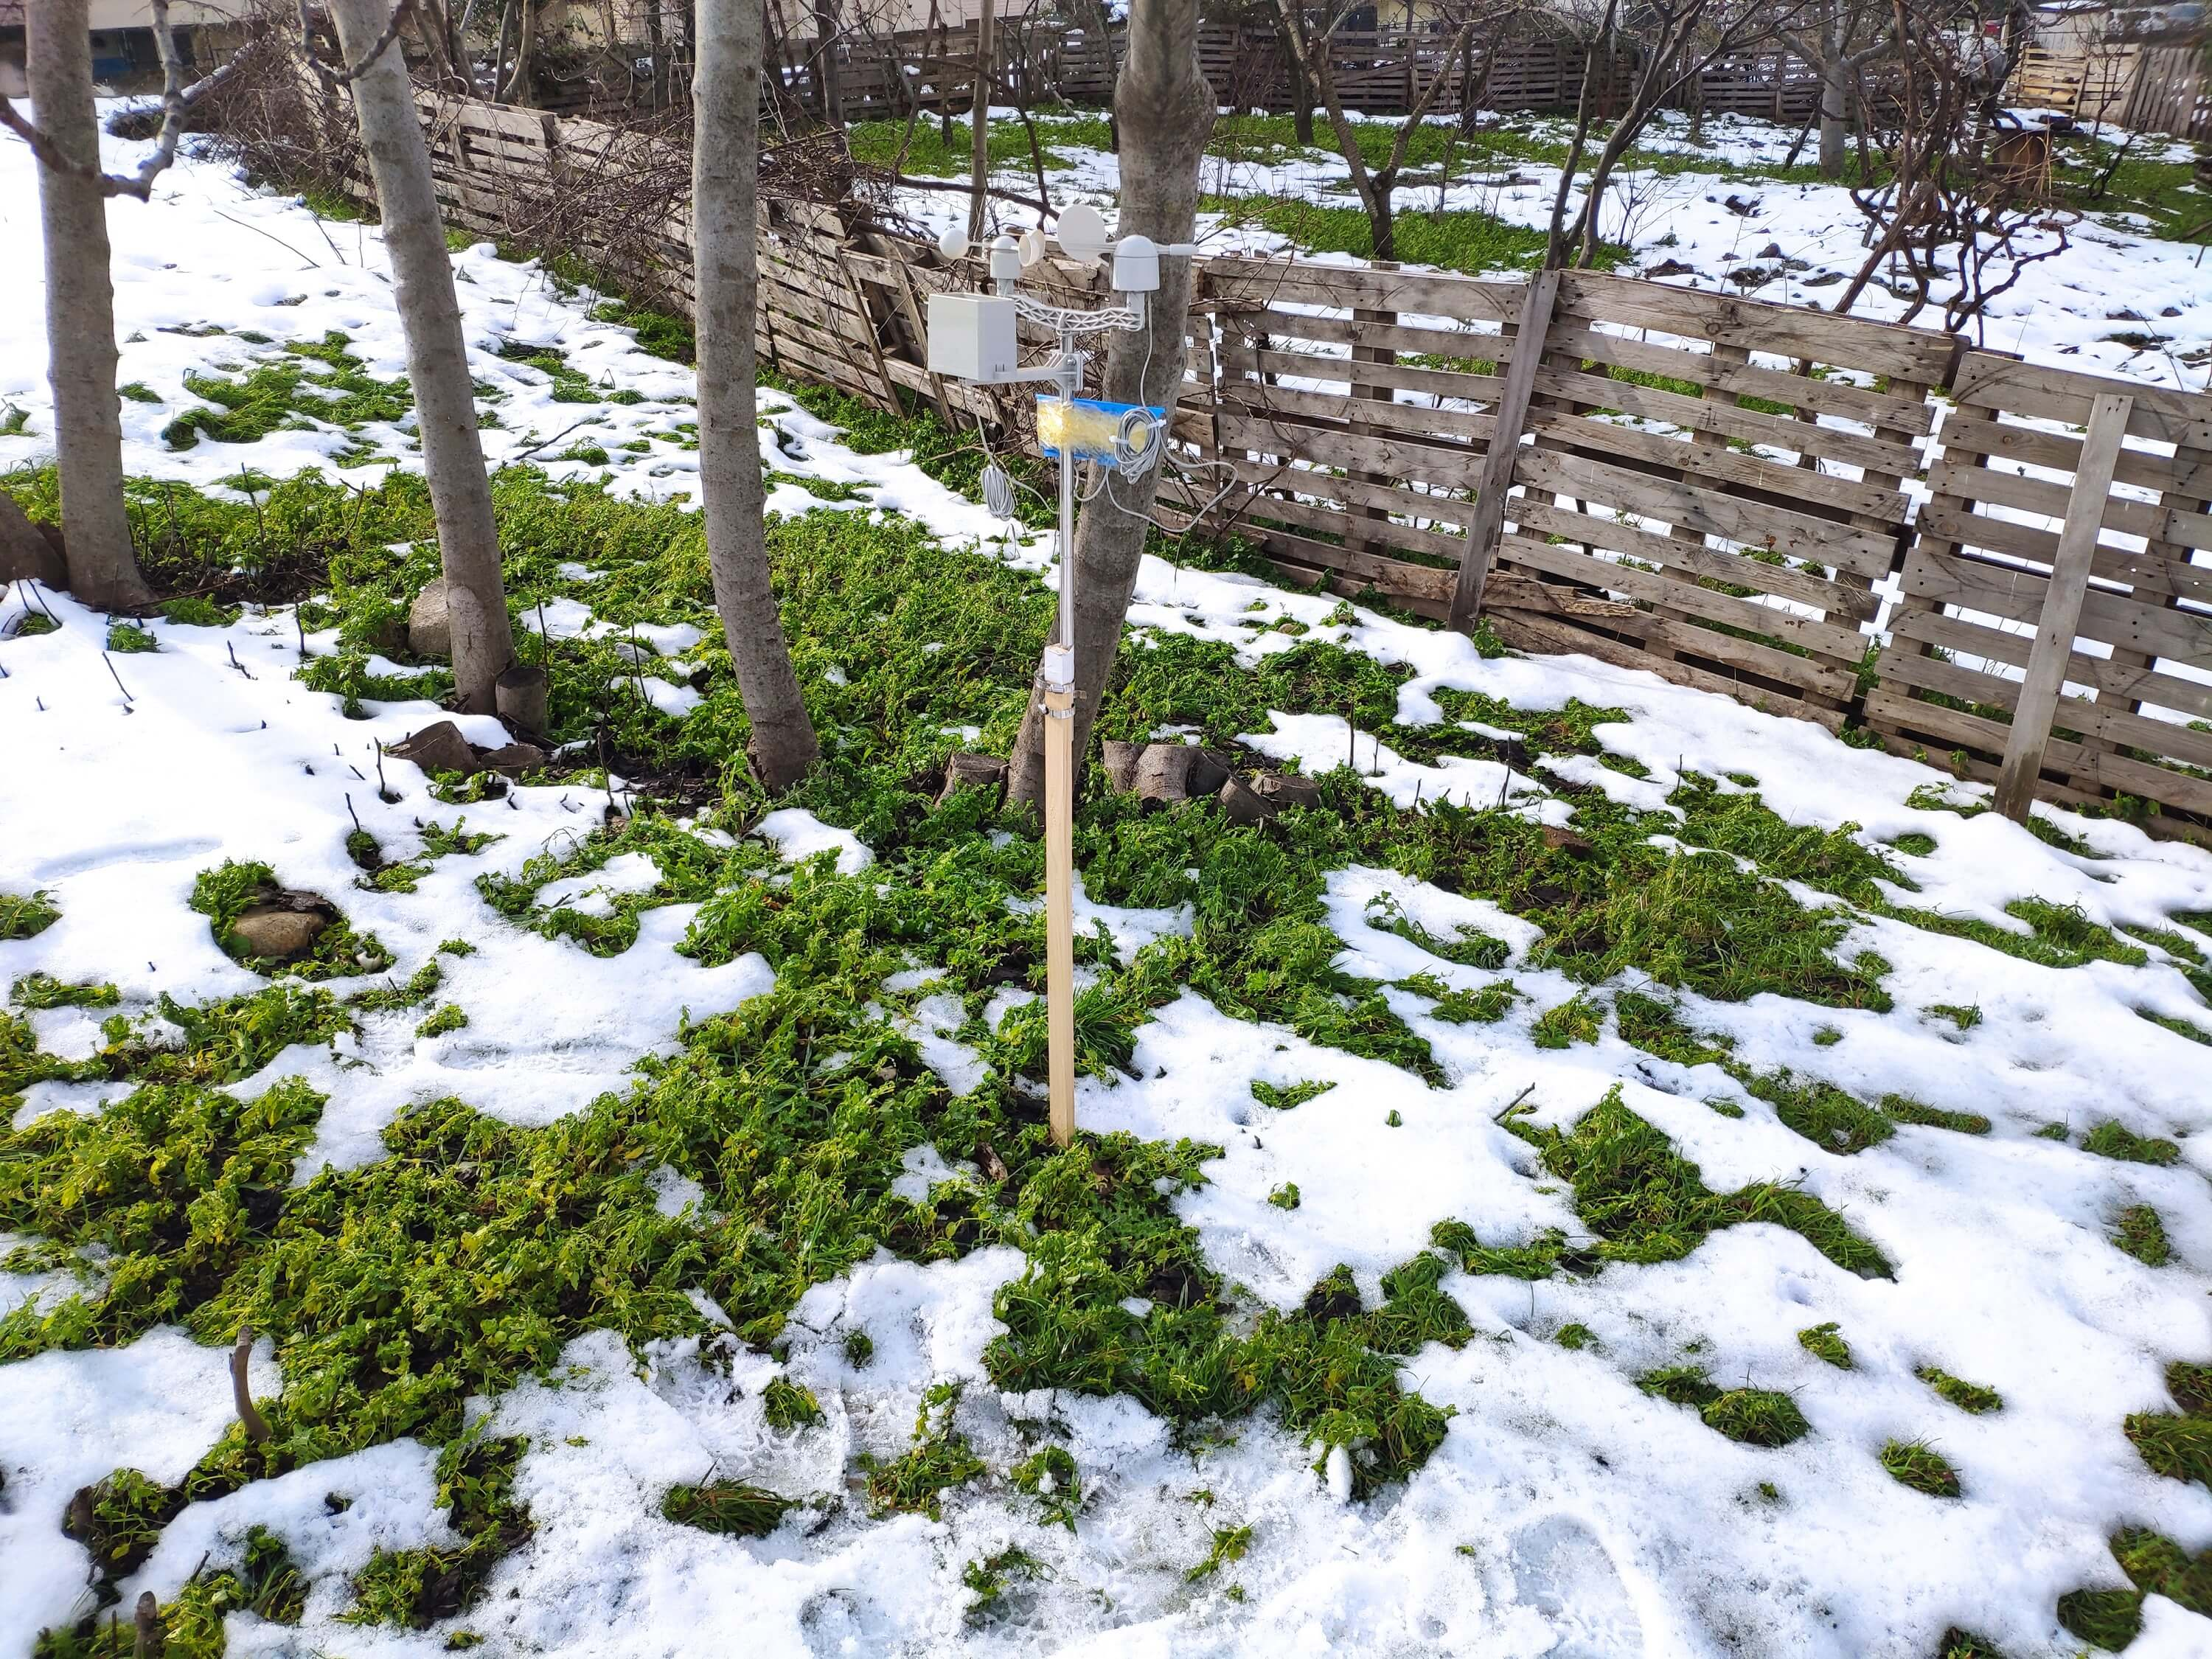
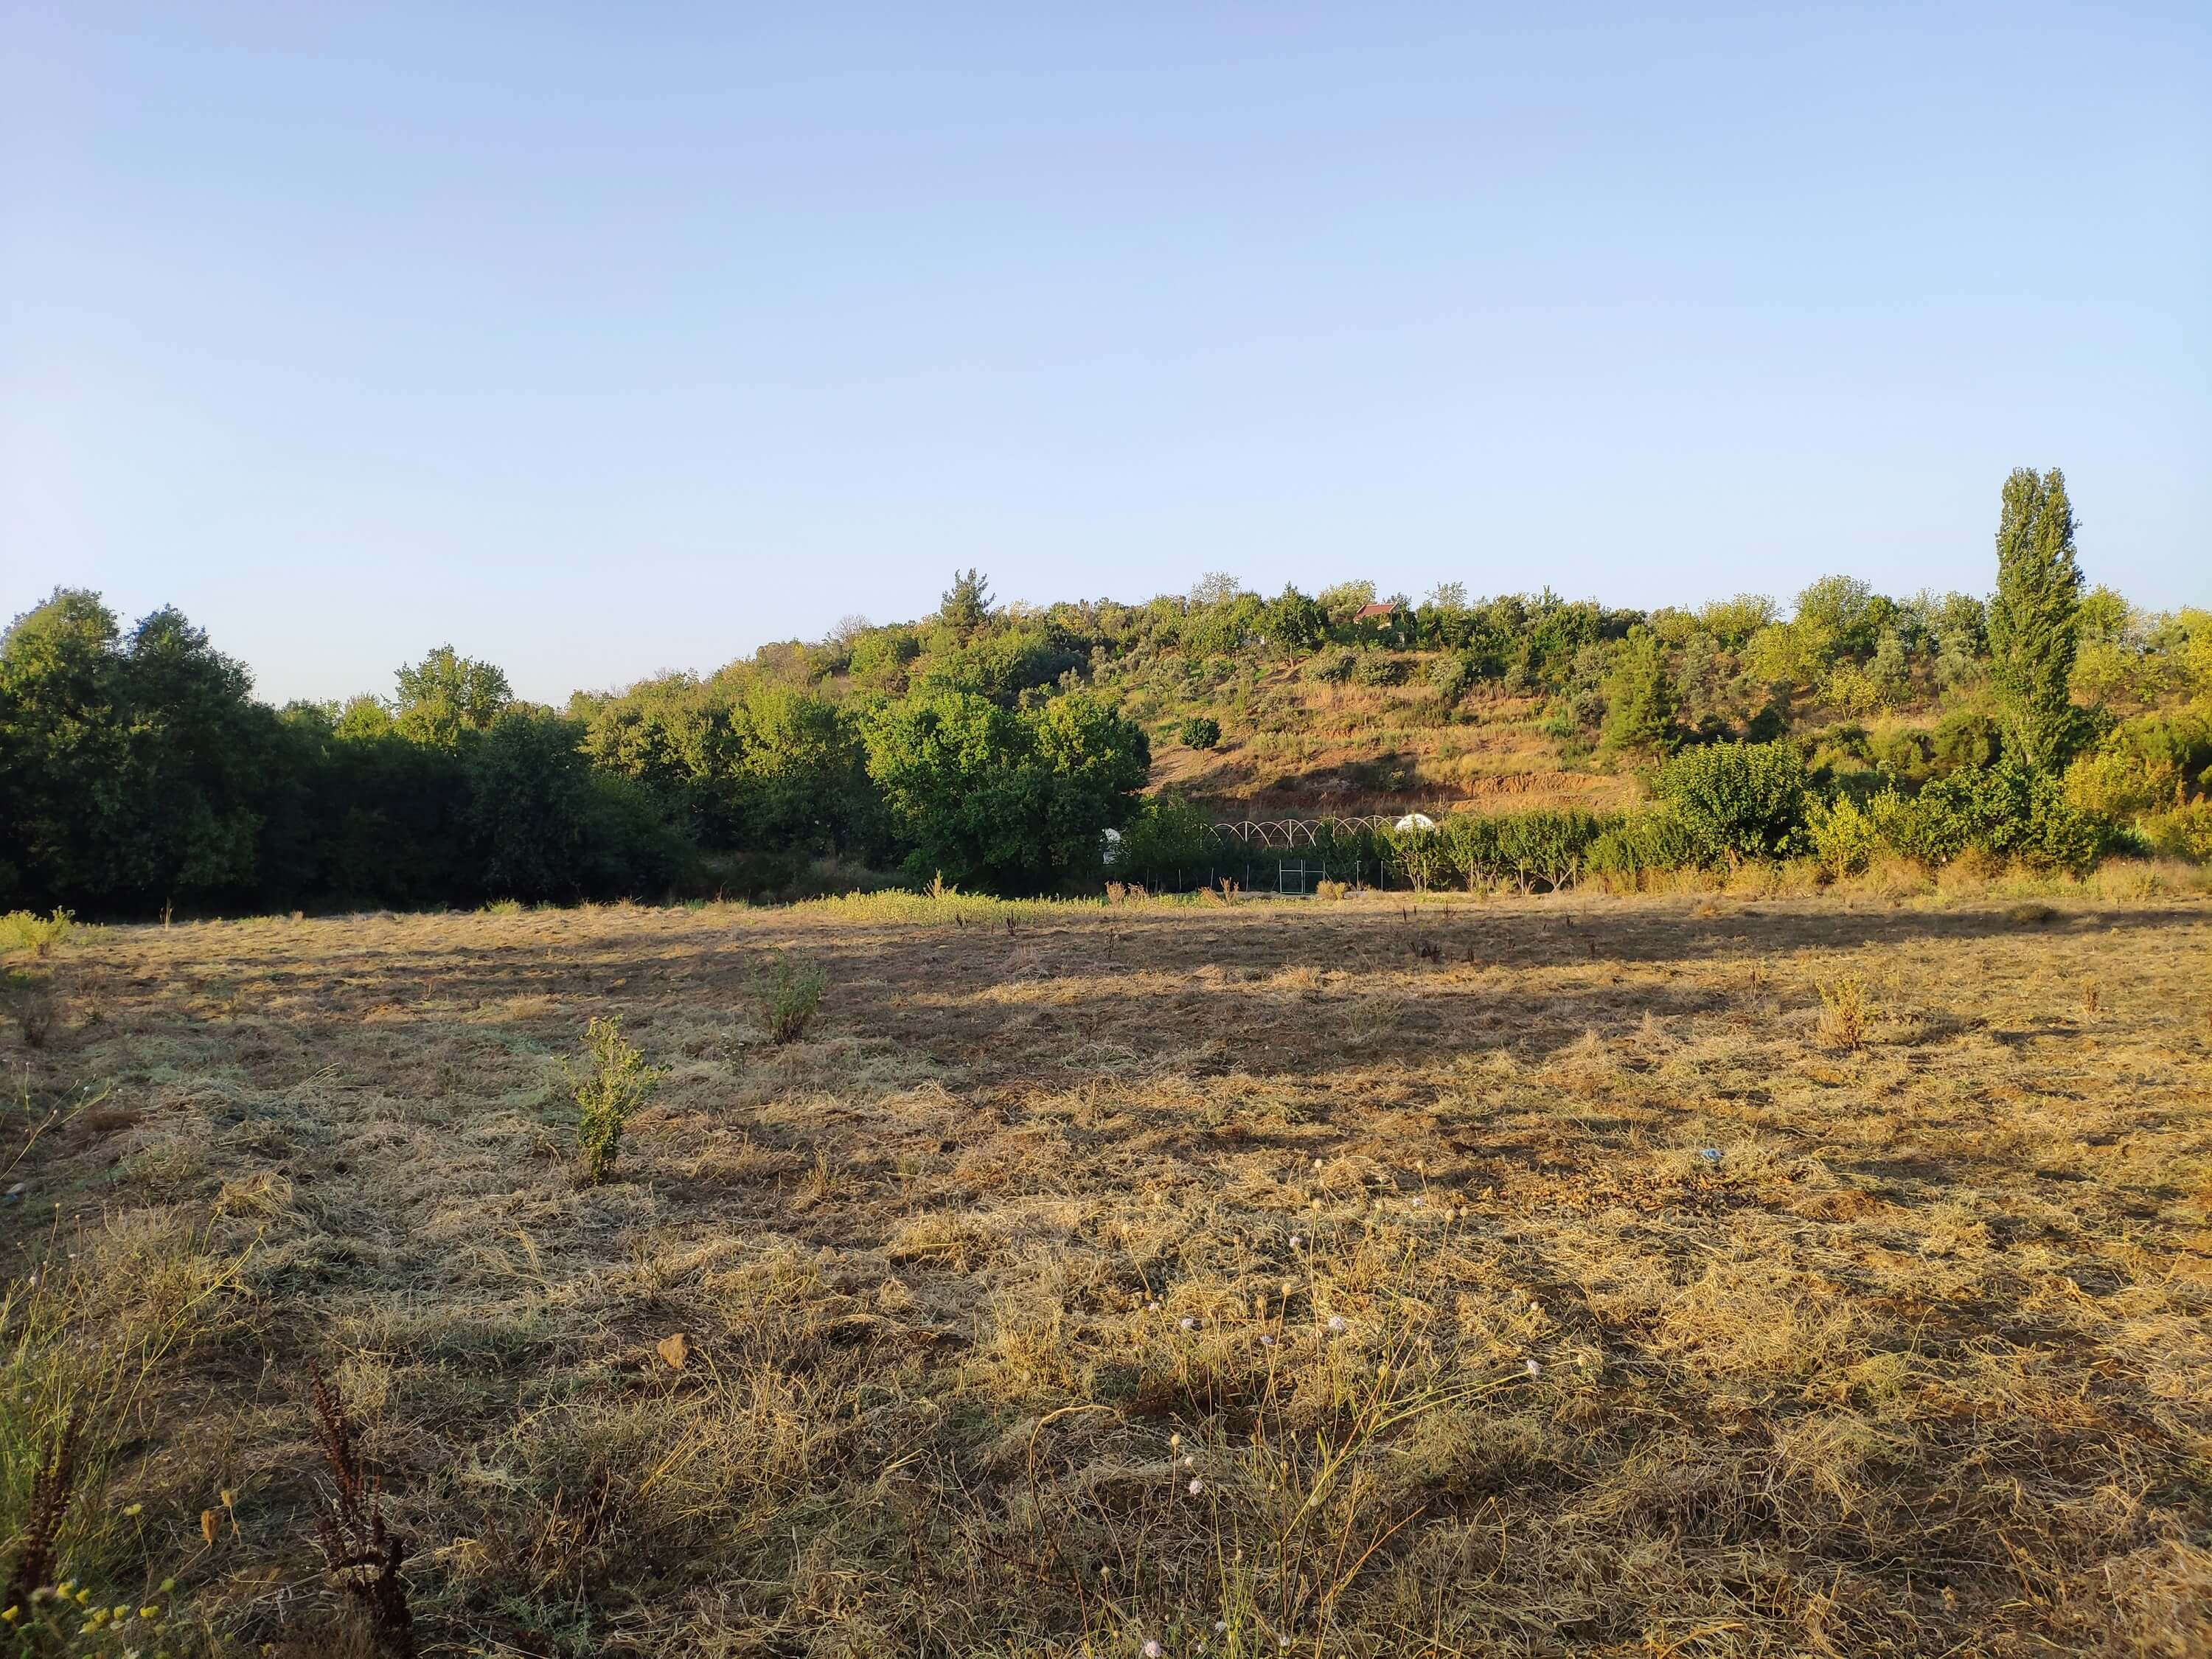
ニューラルネットワークモデルを構築してテストする前に、3か月以上にわたって、半径3 kmのバルコニーと裏庭で気象データを収集して、近所の気象情報を示すローカル気象データセットを作成しました。極端な気象条件でも気象情報を引き出すことができるように、風速計、風向計、およびDFRobotのRainBucketを備えたWeatherStation Kitを、2つの異なる開発ボードとともに使用しました。
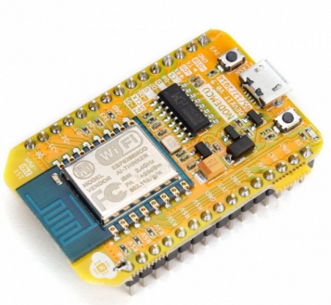
- NodeMCU ESP-12E(WiFi対応)
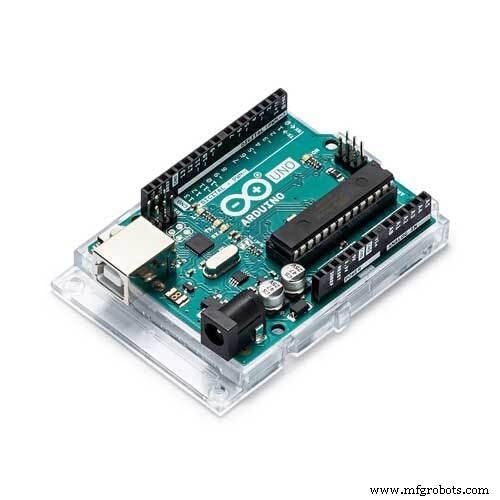
- Arduino Uno + DFRobot SIM808 GPS / GPRS / GSMシールド(GPRS対応)
したがって、ルーターと気象観測所の間の距離が遠すぎる場合は、バルコニーまたはGPRSでWiFi経由で気象データを転送できます。
Google Sheets APIを使用すると、ビッグデータセットの作成と新しい情報の追加が簡単になるため、クラウドベースのスプレッドシートプログラムであるGoogleSheetsを使用して気象ステーションによって生成された気象データを照合することにしました。そこで、PHPでウェブアプリケーションを開発し、開発委員会から転送された気象データを取得して、Googleスプレッドシートのスプレッドシートに追加しました。
5分ごとに3か月以上気象データの収集を完了した後、TensorFlowを使用して人工ニューラルネットワーク(ANN)モデルを構築し、降雨強度を予測しました。理論的には、データセットをスケーリングおよび正規化した後、各読み取り値に降雨強度クラスを割り当てました。次に、これらのクラスを分類するためにニューラルネットワークモデルをトレーニングしました。
- 降雨なし
- 小雨
- 中程度の降雨量
- 大雨
- 激しい降雨
だから、これは一言で言えば私のプロジェクトです😃
次の手順では、コーディング、地域の気象データ収集、TensorFlowを使用した人工ニューラルネットワーク(ANN)モデルの構築に関する詳細情報を見つけることができます。
このプロジェクトを後援してくれたDFRobotに大いに感謝します。
DFRobotによるスポンサー製品:
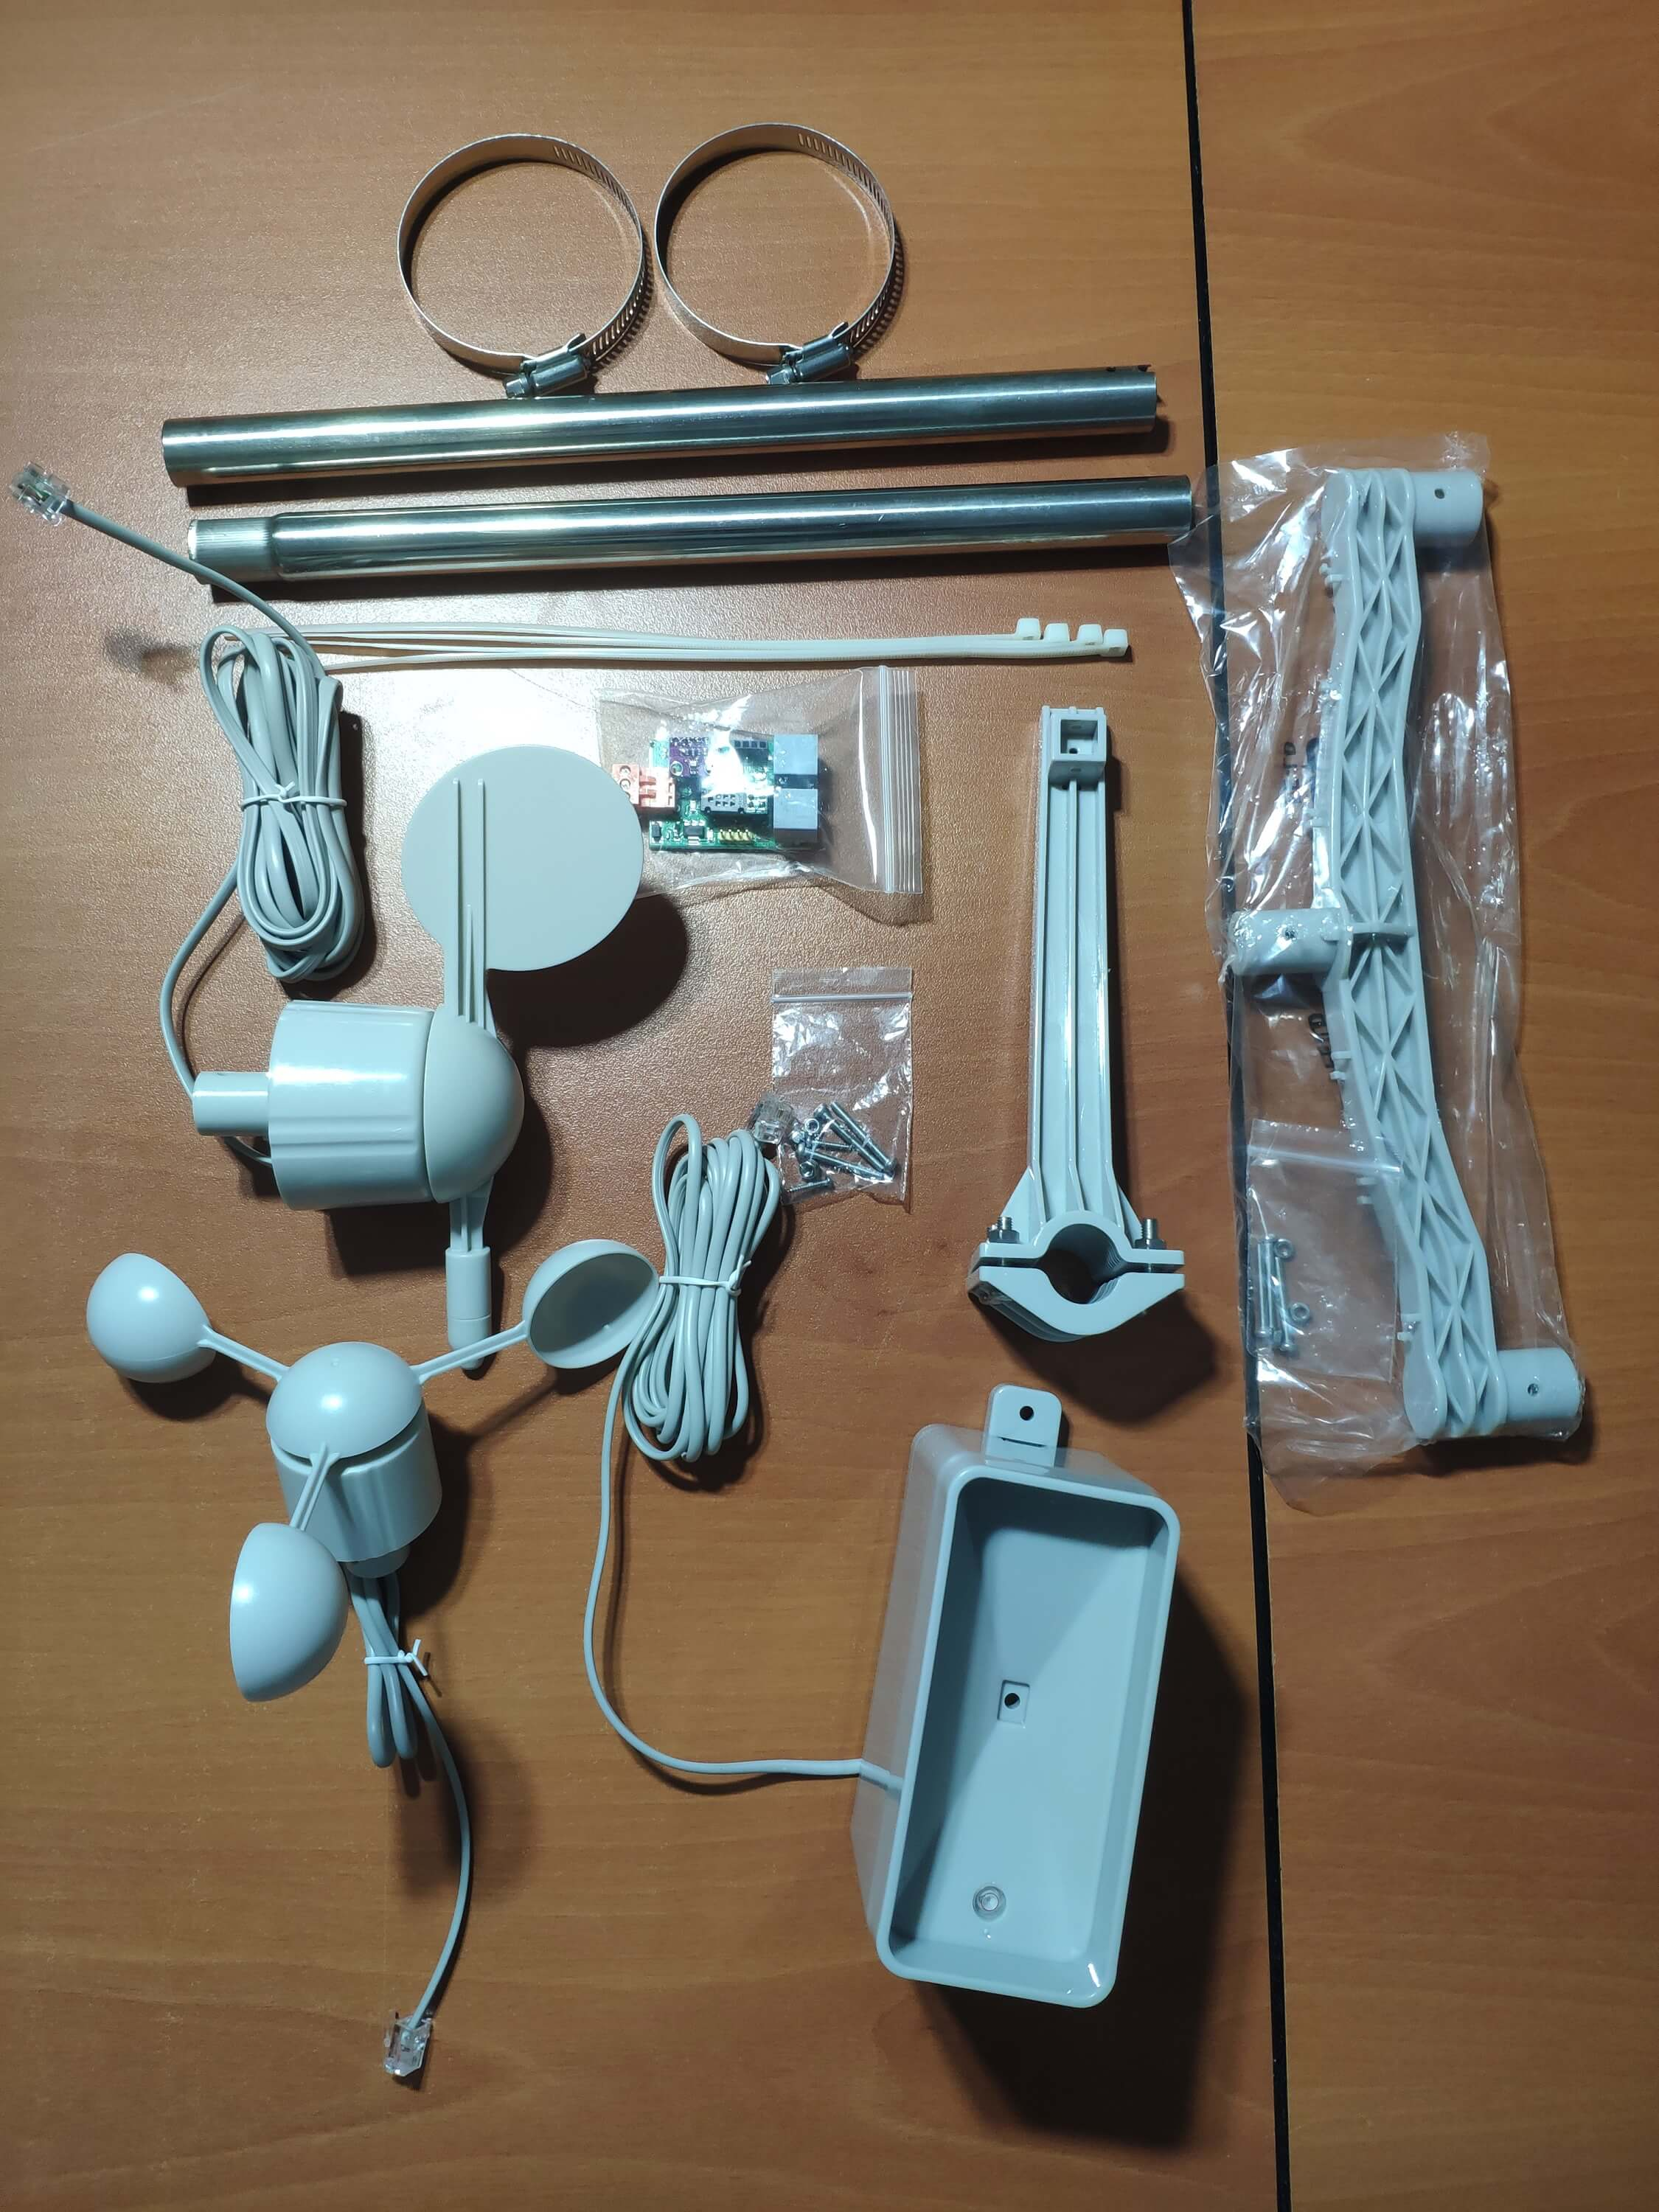
⭐風速計/風向計/レインバケット付きウェザーステーションキット|検査
⭐Arduino用のSIM808GPS / GPRS / GSMシールド|検査
<図>
<図>
<図>
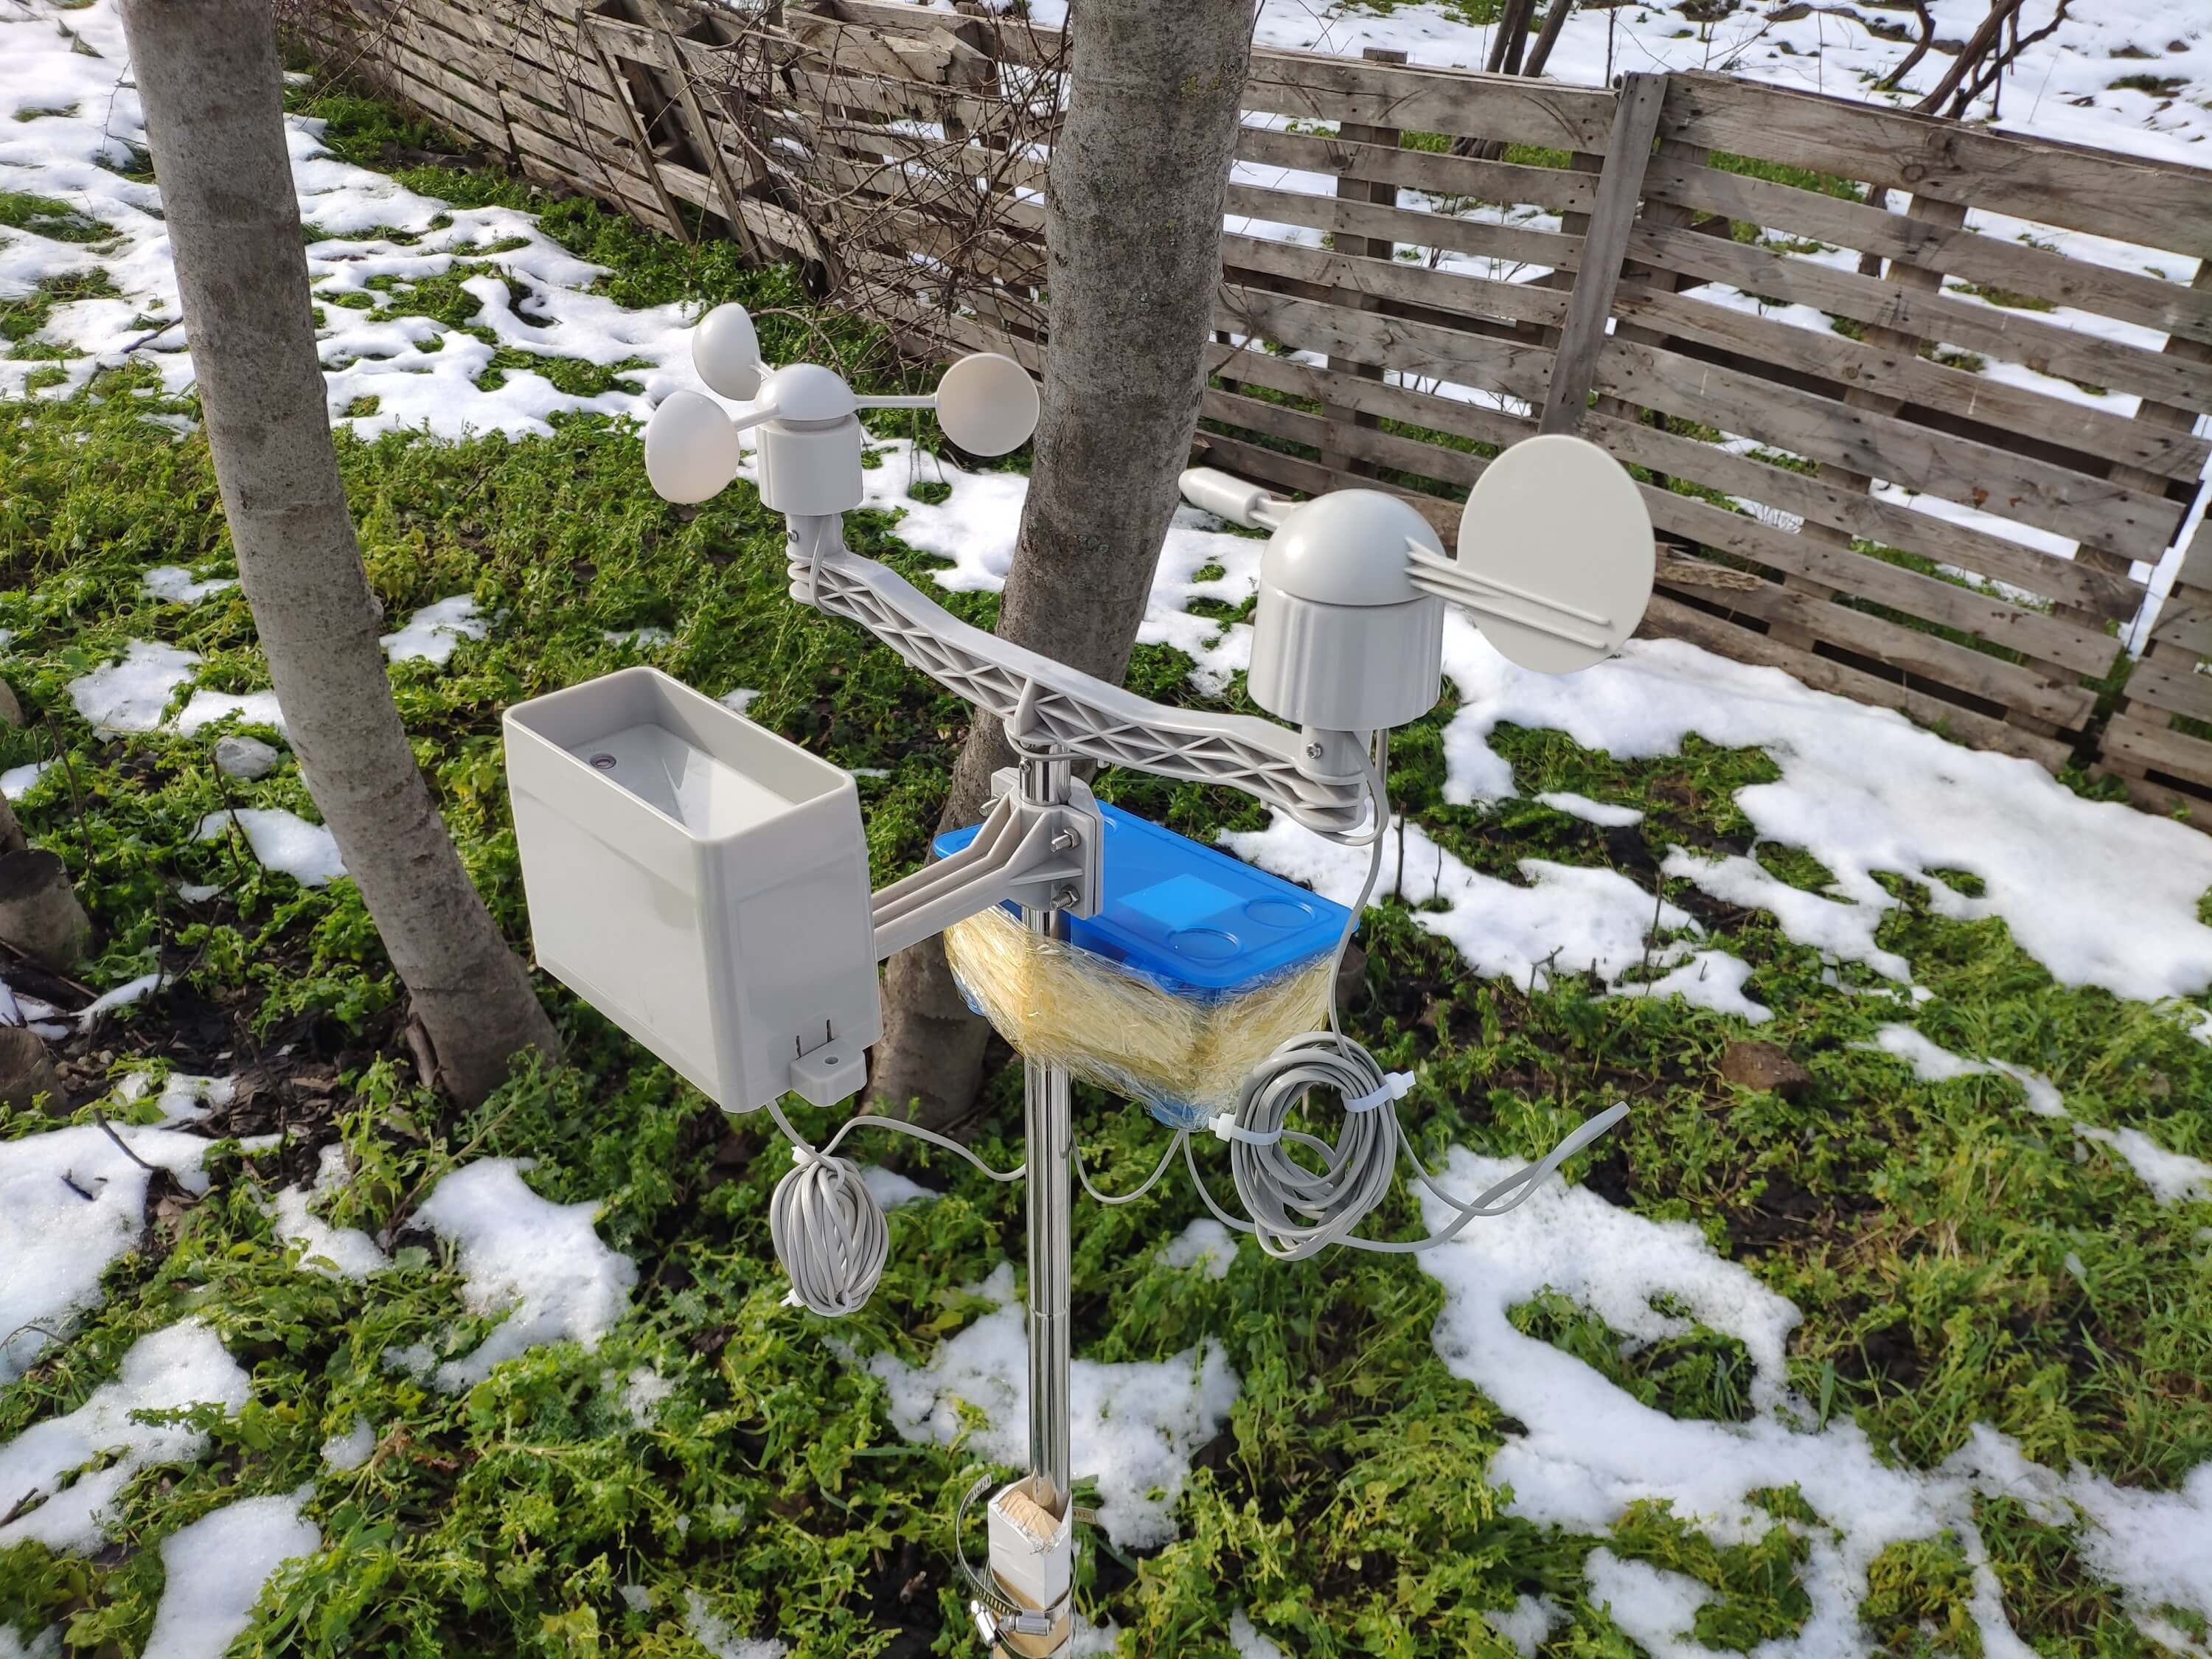
ステップ1:風速計、風向計、レインバケットを備えた気象観測所キットの組み立て
この気象観測所キットには、風速計、風のつる、雨のバケツ、およびシリアル通信プロトコルを介して気象データを送信するためのセンサーボードが含まれています。したがって、開発ボードを使用して地域の気象データを収集するのは簡単です。
終了 CR / LF を含め、毎秒37バイトを出力します。 。
c000s000g000t086r000p000h53b10020 データパーサー:
- c000 :空気の方向、程度
- s000 :対気速度(平均)、時速0.1マイル
- g000 :対気速度(最大)、時速0.1マイル
- t086 :温度、華氏
- r000 :降雨量(1時間)、0.01インチ
- p000 :降雨量(24時間)、0.01インチ
- h53 :湿度、%(00%=100)
- b10020 :雰囲気、0.1 hPa
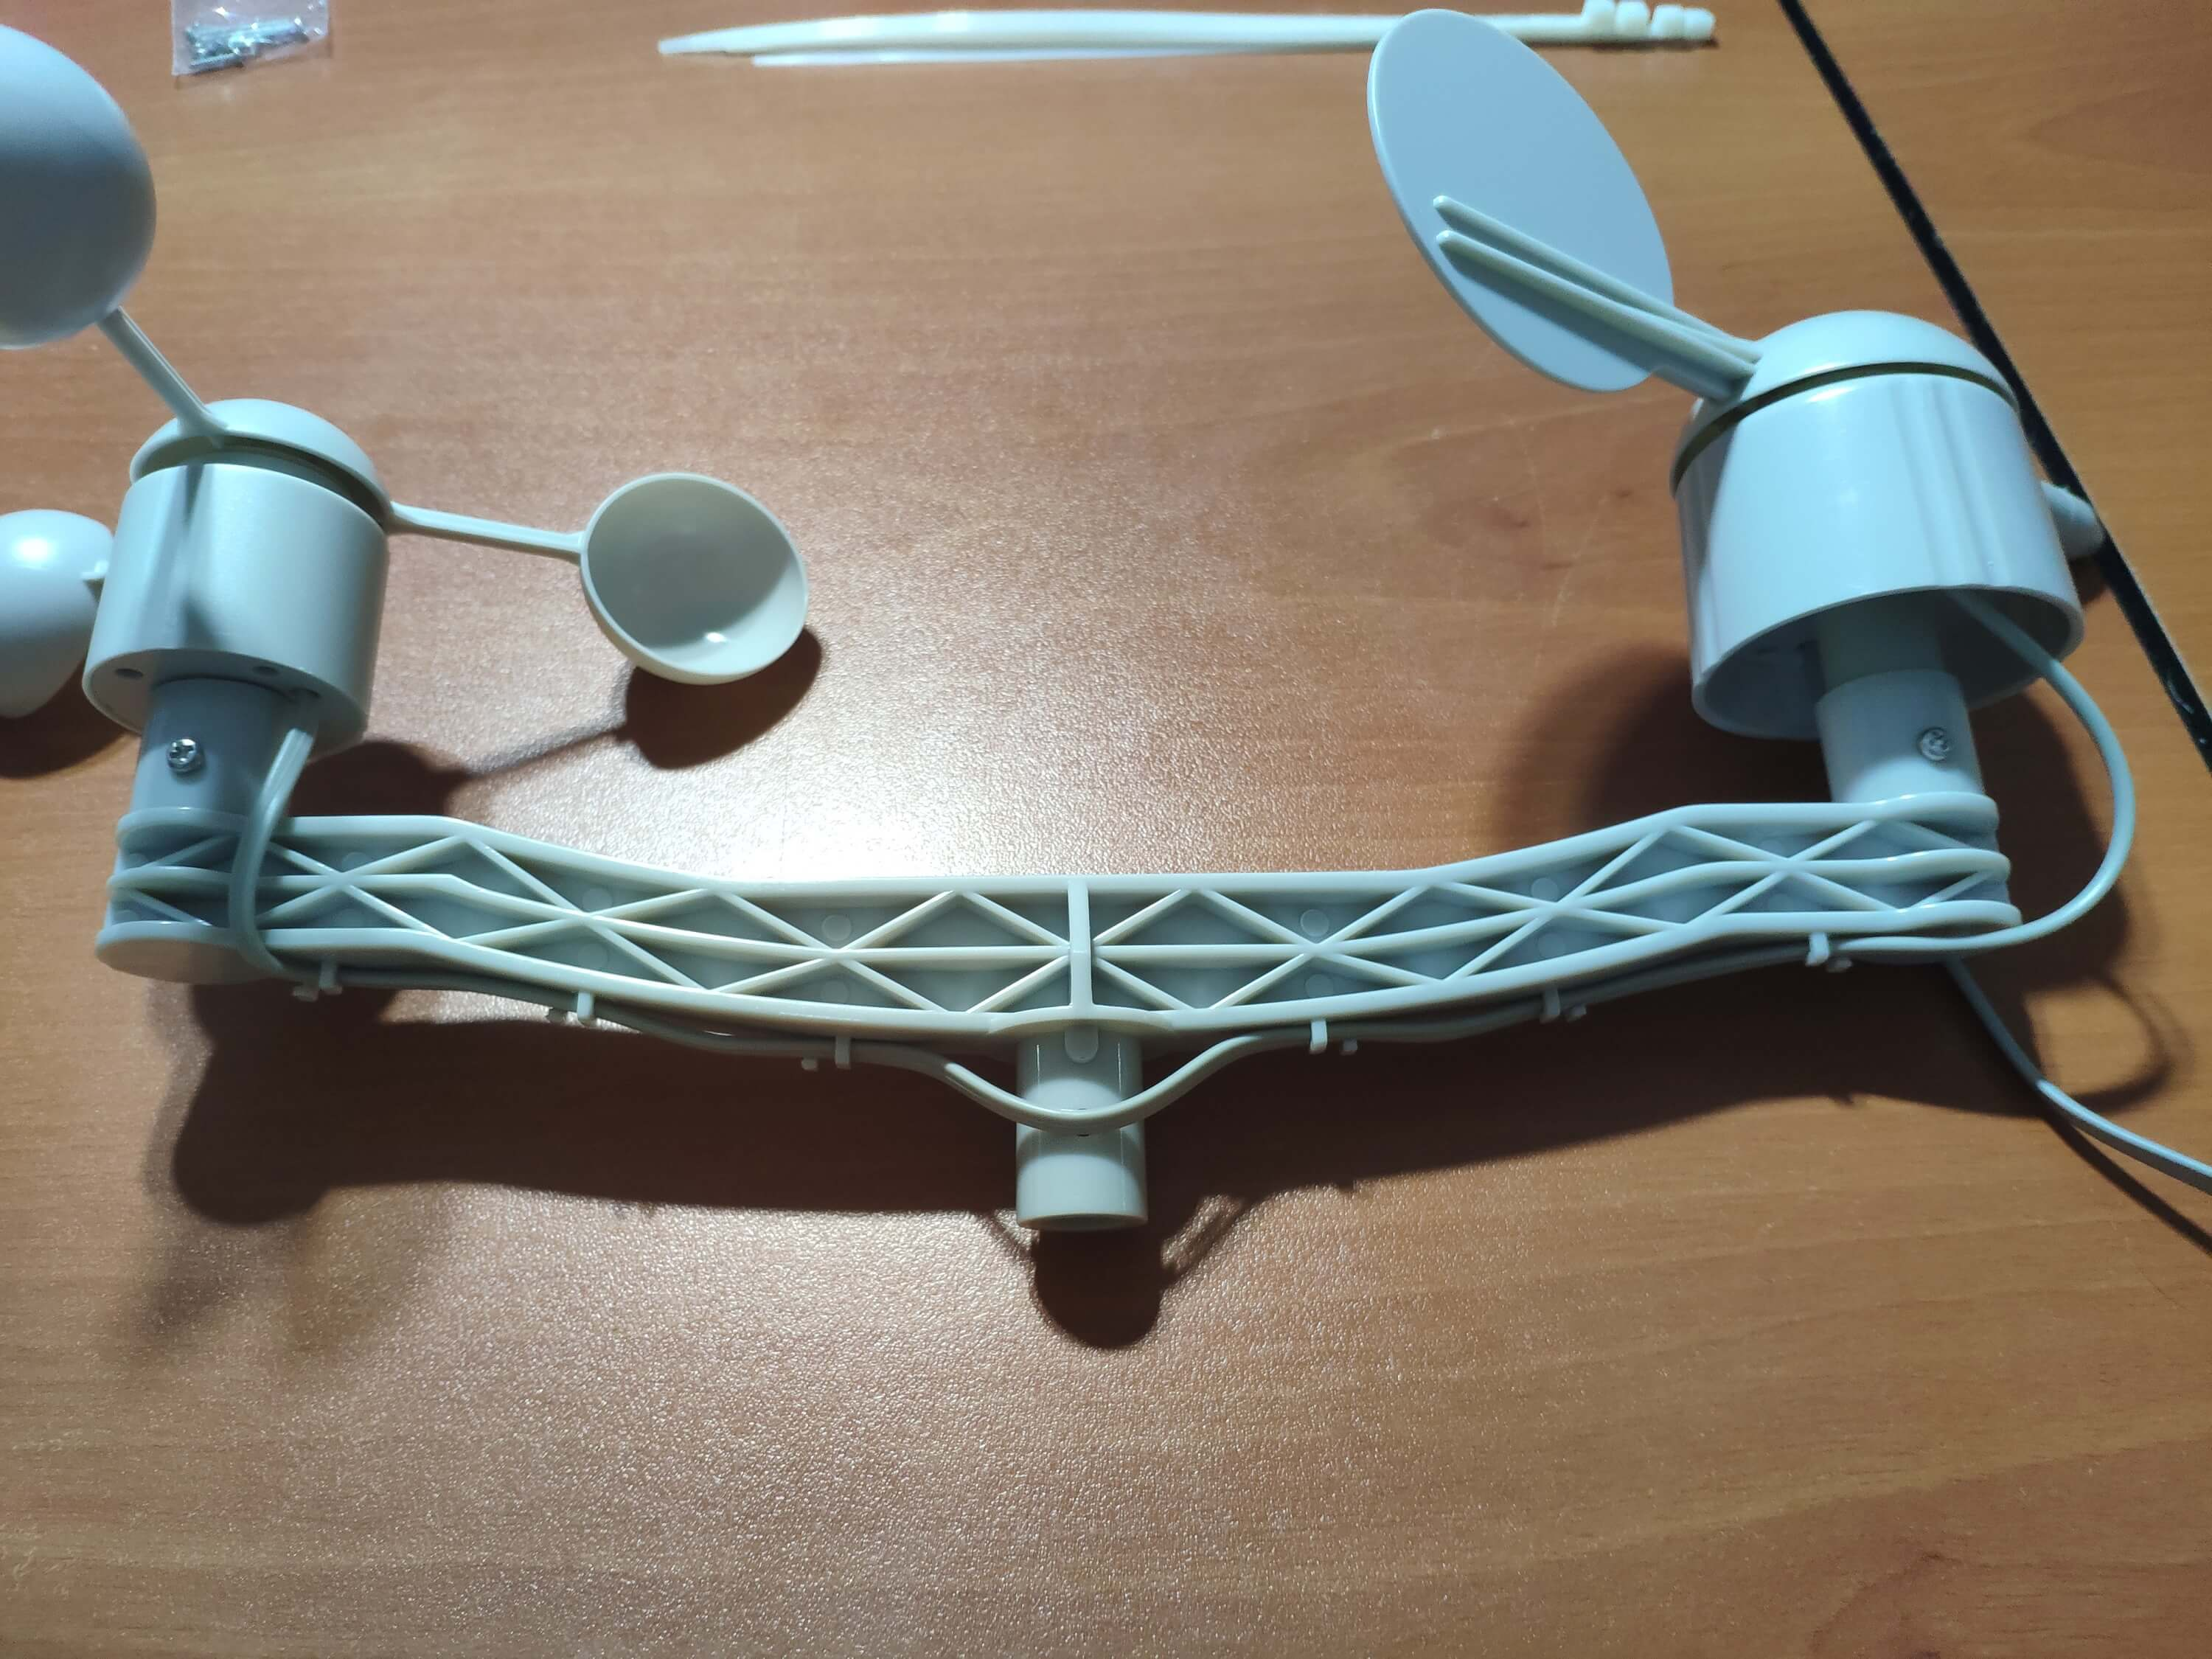
⭐まず、ネジとナットを使用して、風速計と風向計を橋に取り付けます。
⭐RJ11電話コードを使用して風見鶏を風速計に接続し、橋の下で締めます。
<図>
<図>
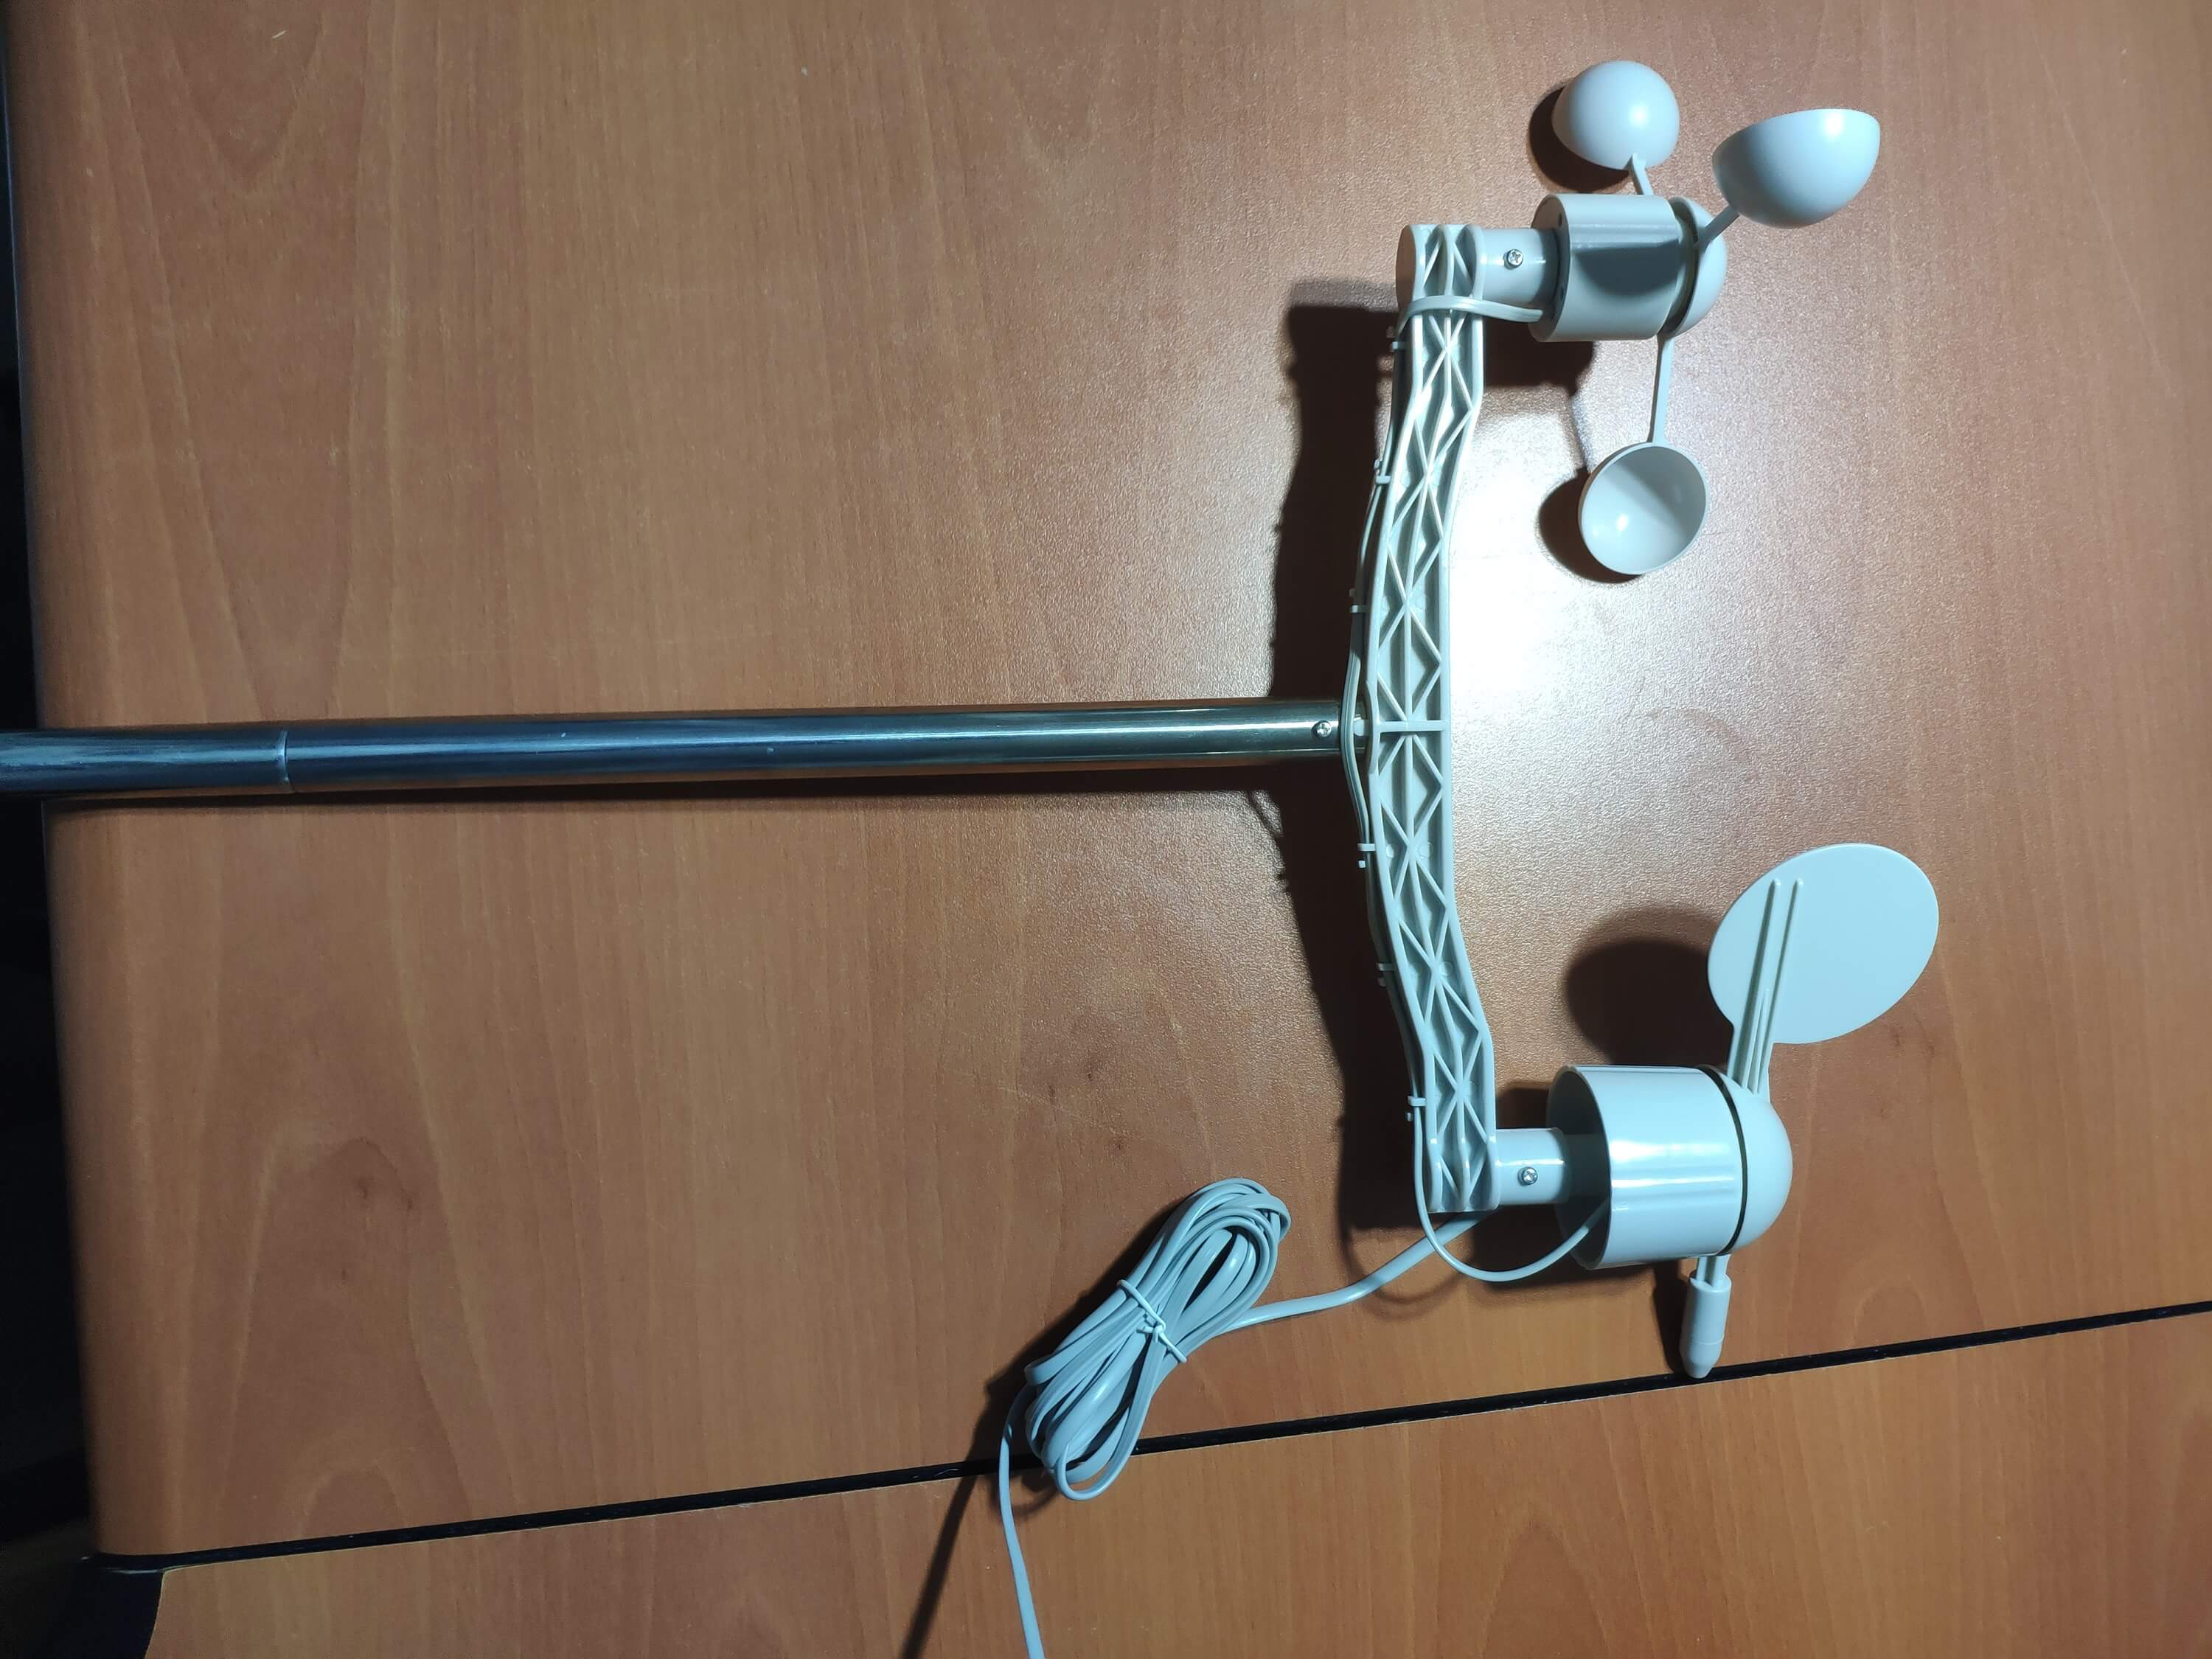
⭐次に、ステンレス鋼の棒をネジでブリッジに取り付けます。
<図>
⭐レインバケットジョイントをレインバケットの下にネジで取り付けます。
<図>
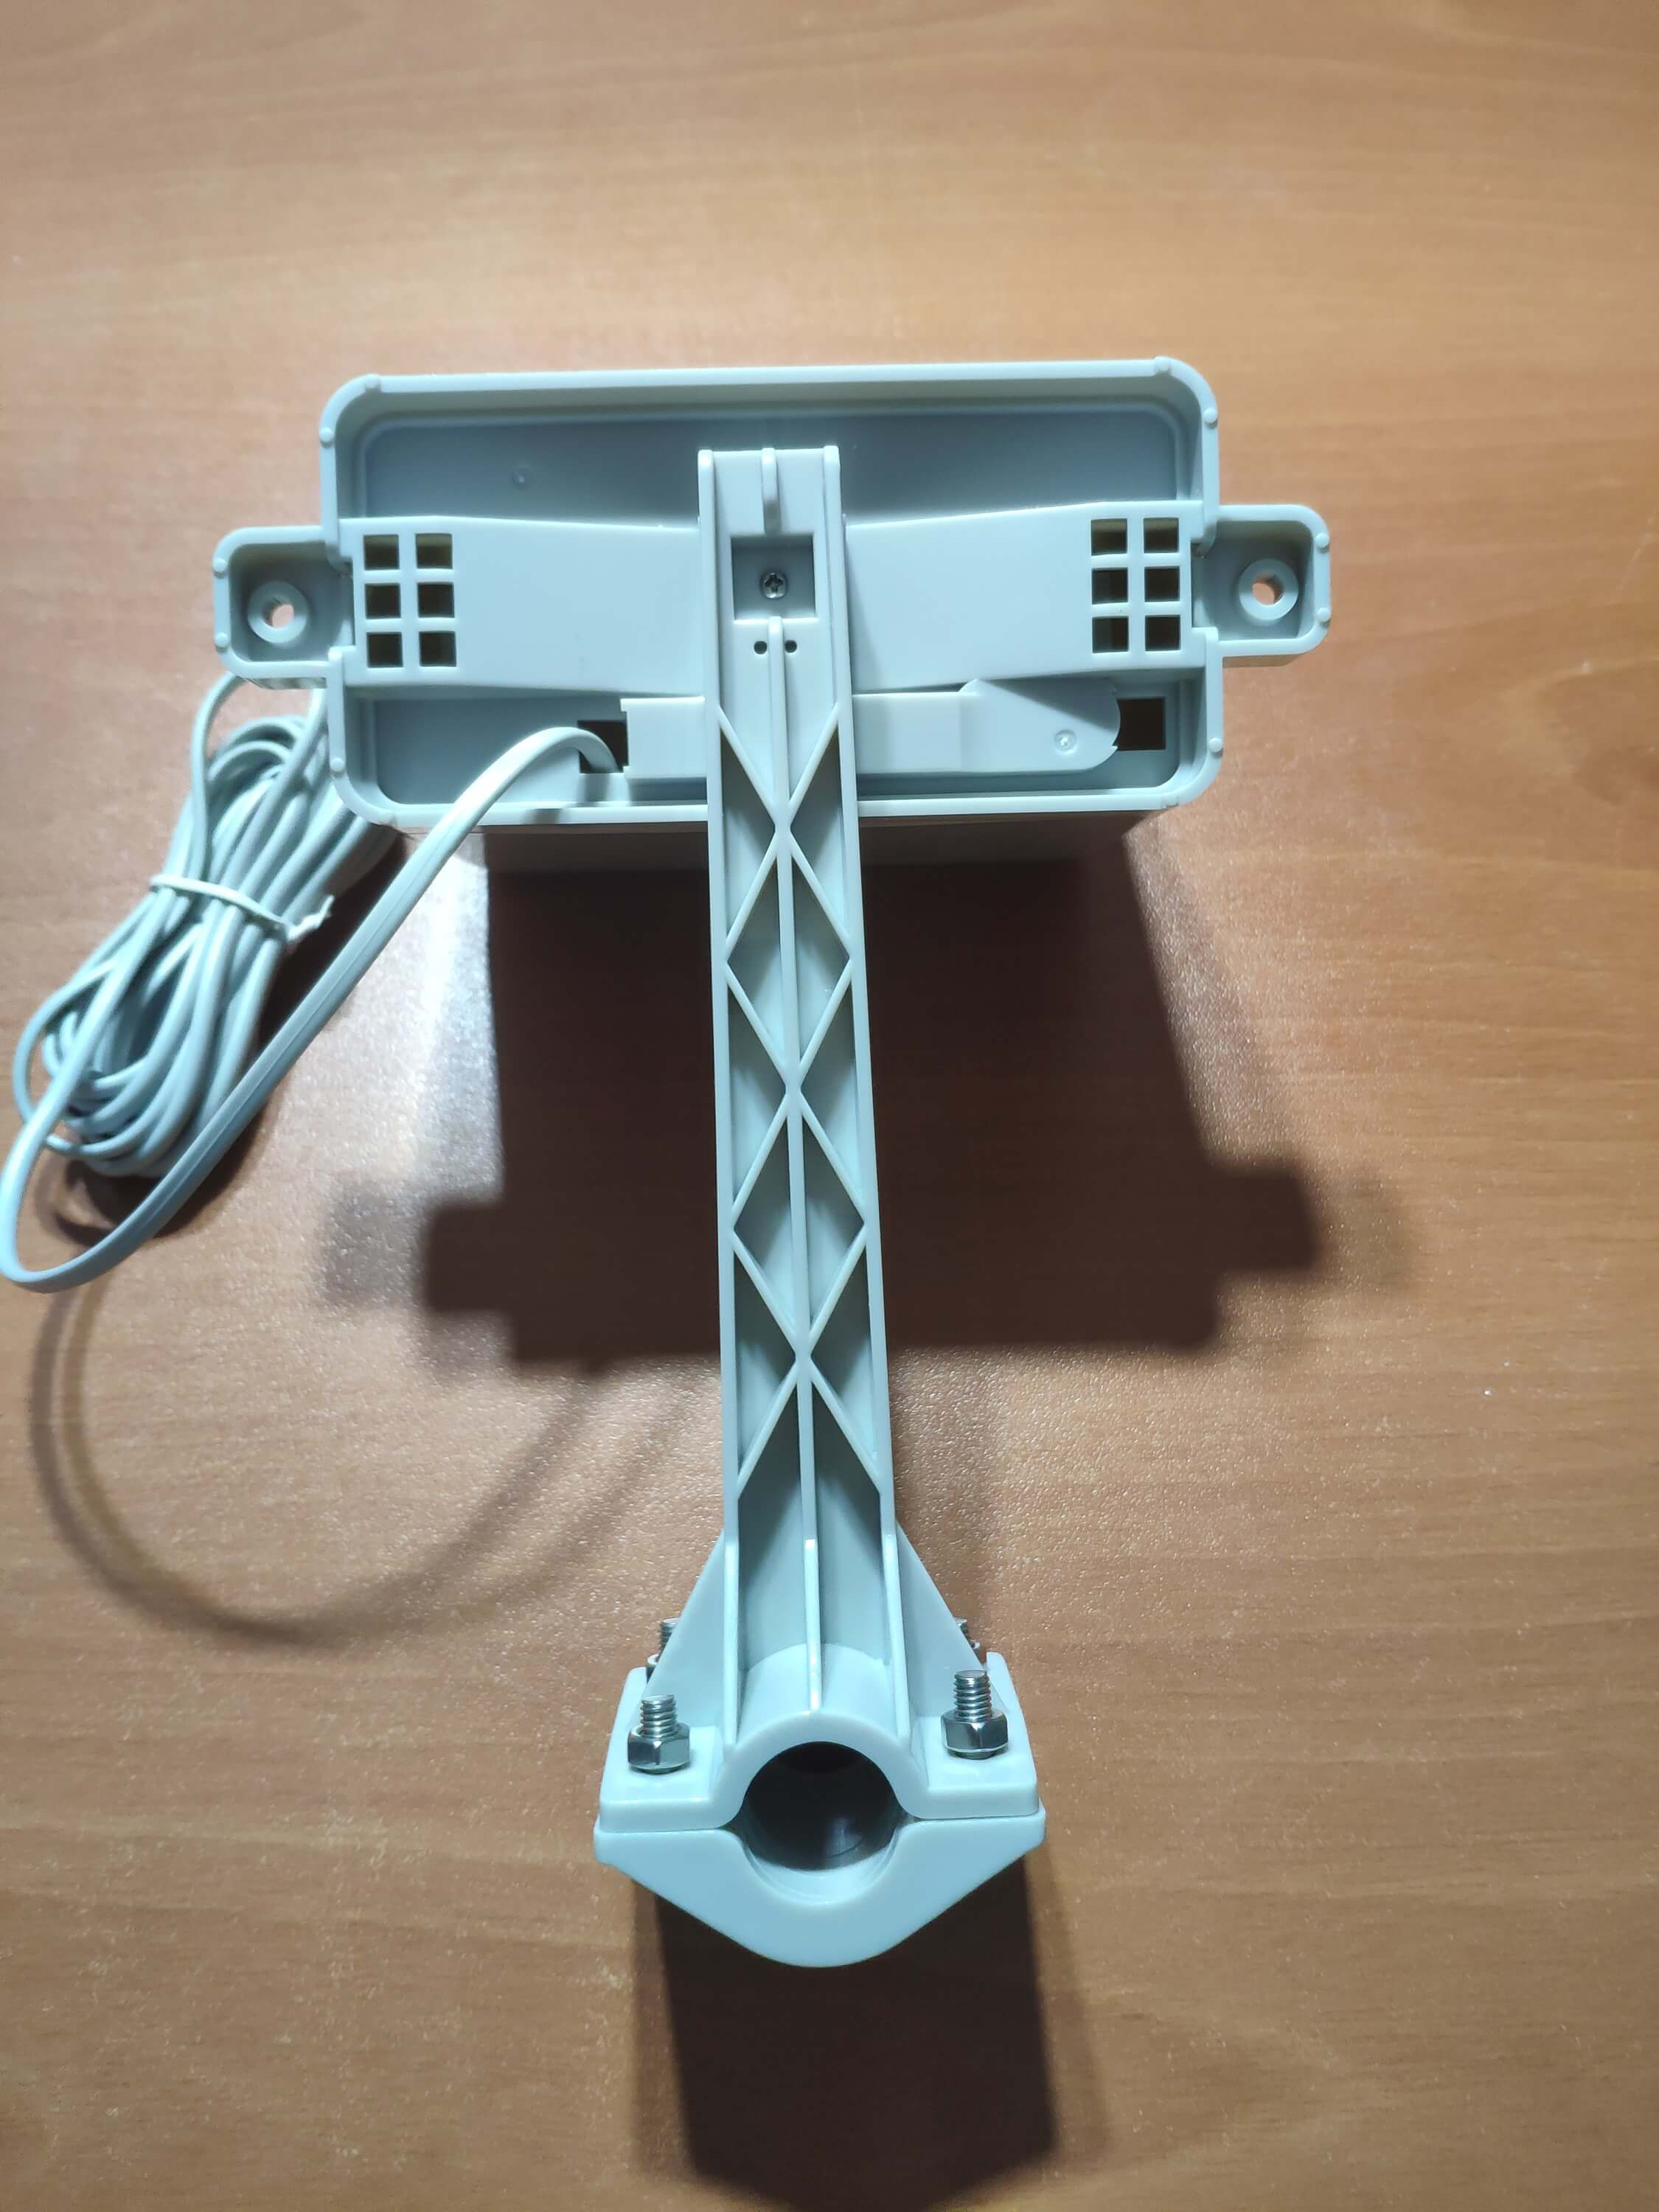
⭐最後に、ネジとナットを使用して、レインバケットをステンレス鋼の棒に置きます。
<図>
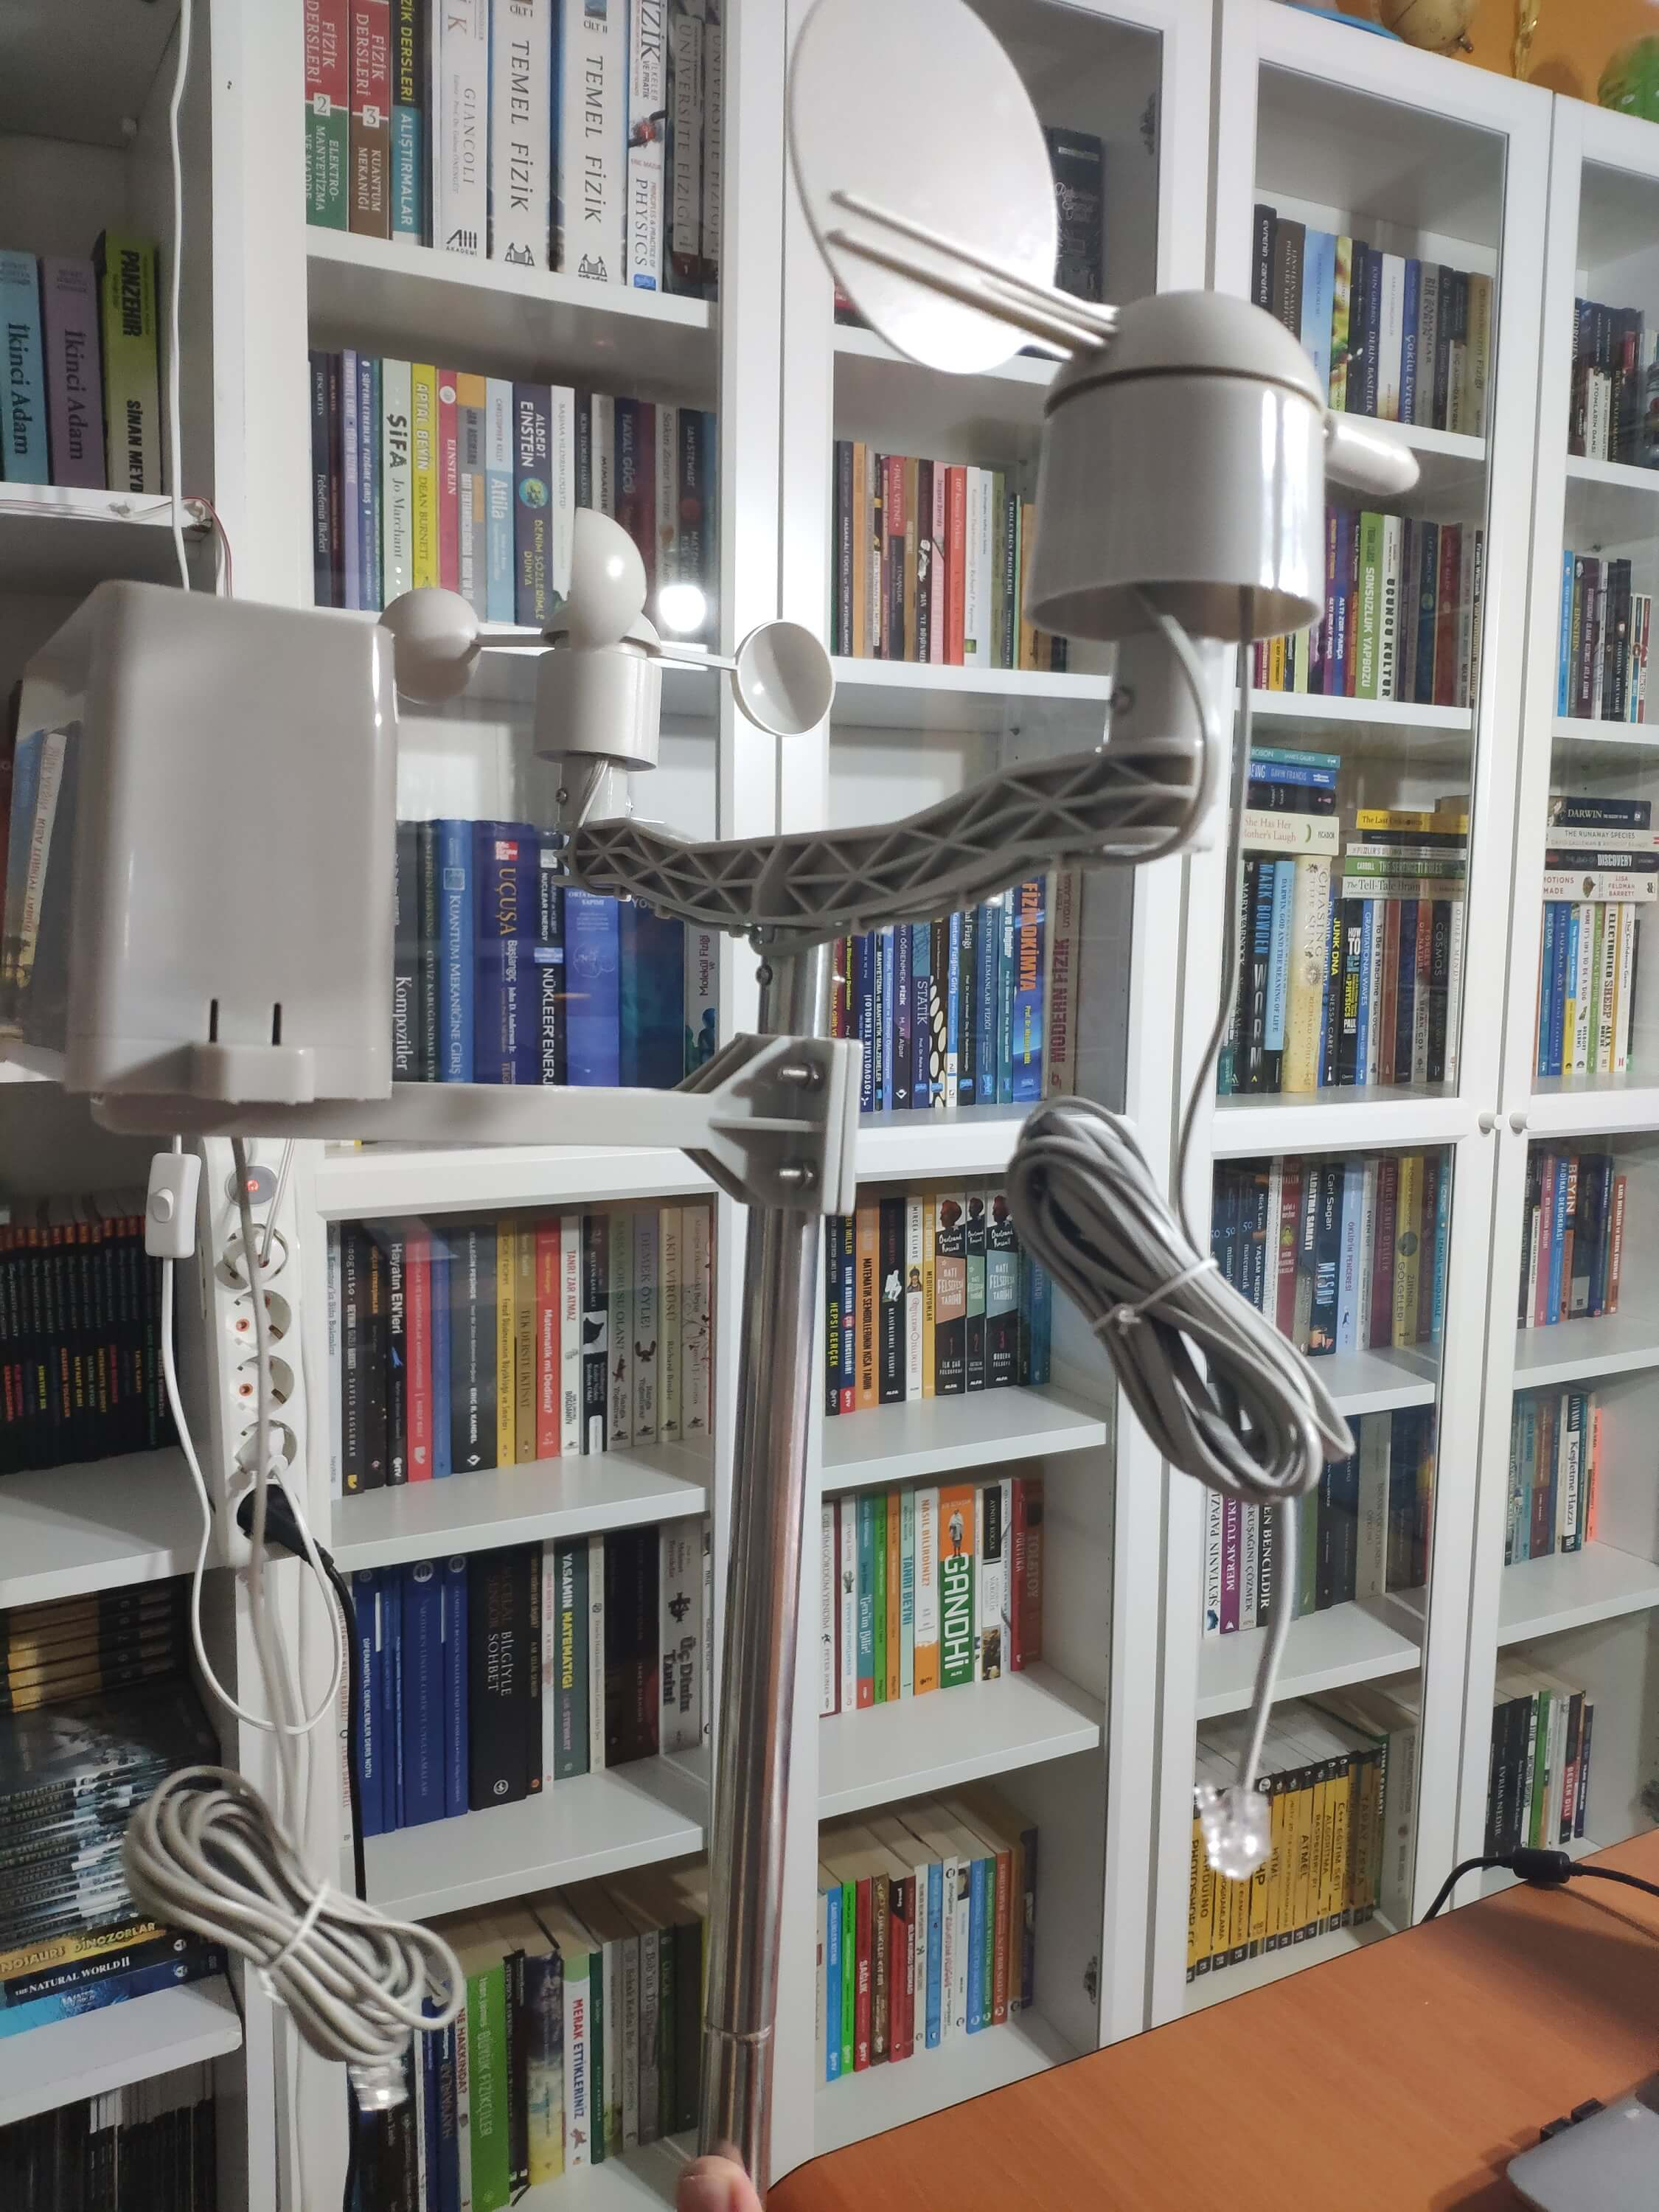
⭐これで、極端な気象条件でも気象データを収集する準備が整いました。ただし、センサー(コンバーター)ボードは耐候性がないため、センサーボードとSIM808シールドを屋外で保護するために、ウェザーステーションにプラスチックの箱を追加しました。
ステップ2:Googleスプレッドシートで気象データを収集する
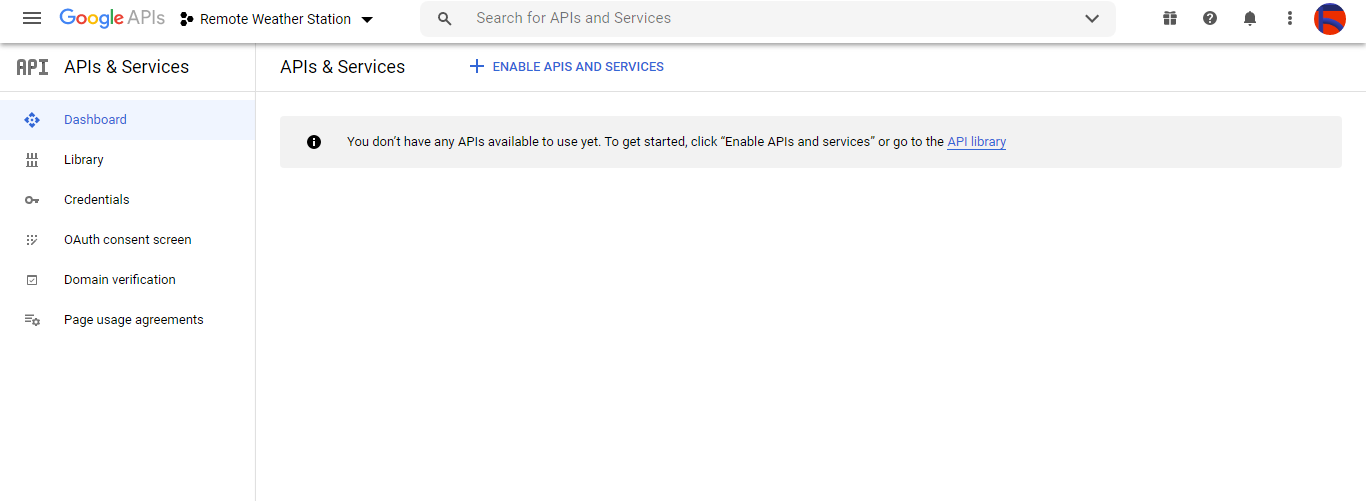
Googleスプレッドシートのスプレッドシートに情報を送信できるようにするには、Googleデベロッパーコンソールで新しいアプリケーションを作成し、GoogleスプレッドシートAPIを利用するための確認資格を取得する必要があります。 Googleデベロッパーコンソールを使用してアプリケーションを作成する初心者の場合は、以下の手順に従ってください。
⭐Googleデベロッパーコンソールに移動し、[新しいプロジェクト]ボタンをクリックします。プロジェクト名を Remote Weather Station として入力します 。
<図>

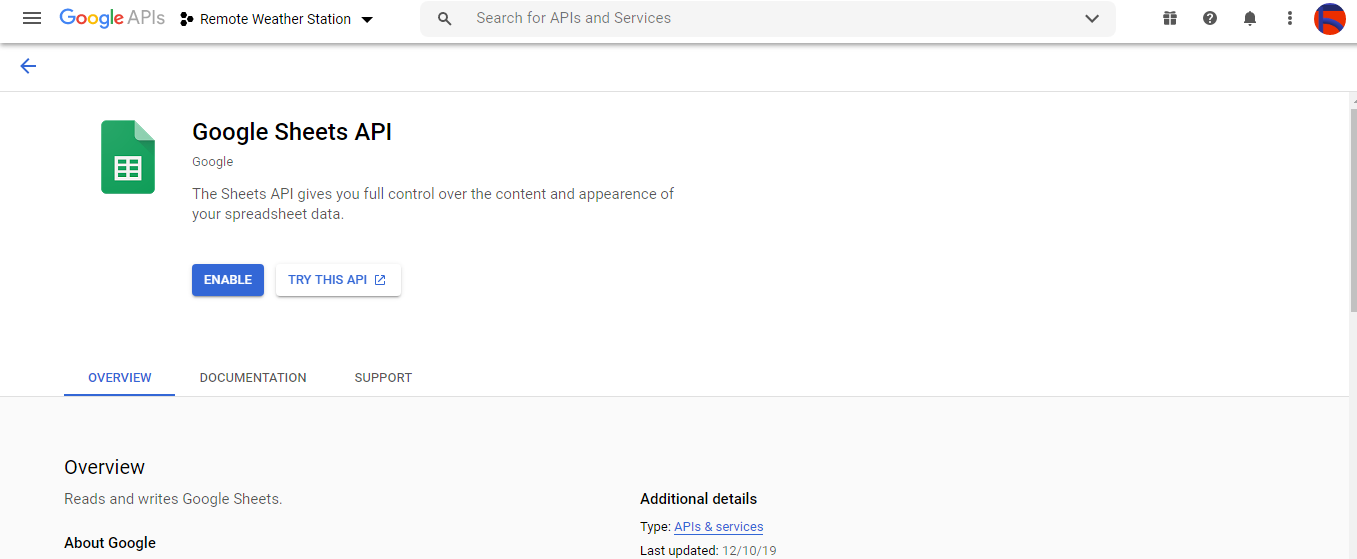
⭐ APIとサービスに移動します APIライブラリをクリックして、Google SheetsAPIを有効にします。
<図>
<図>
ステップ2.1:Google SheetsAPIを使用するためのクレデンシャルを取得する
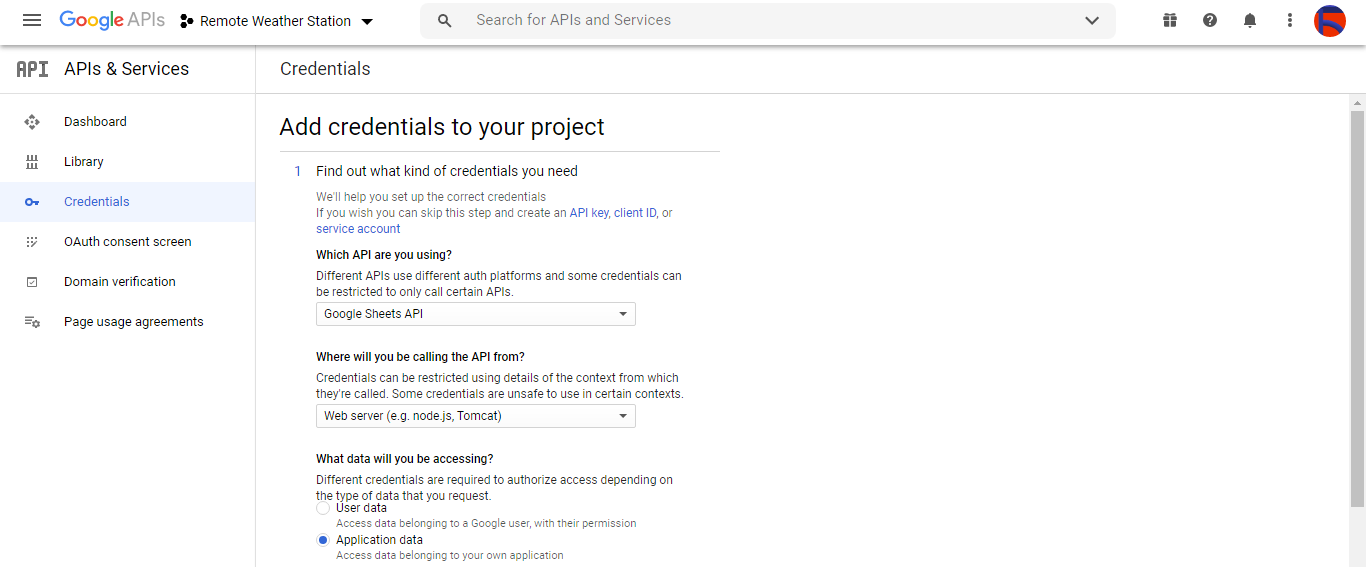
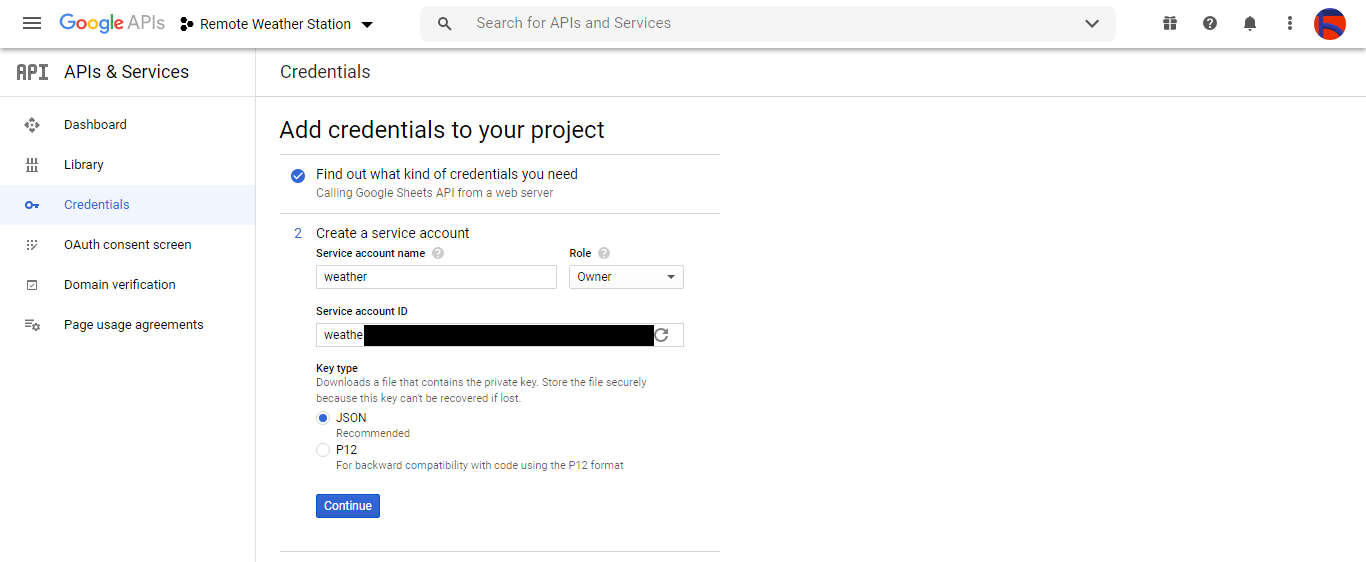
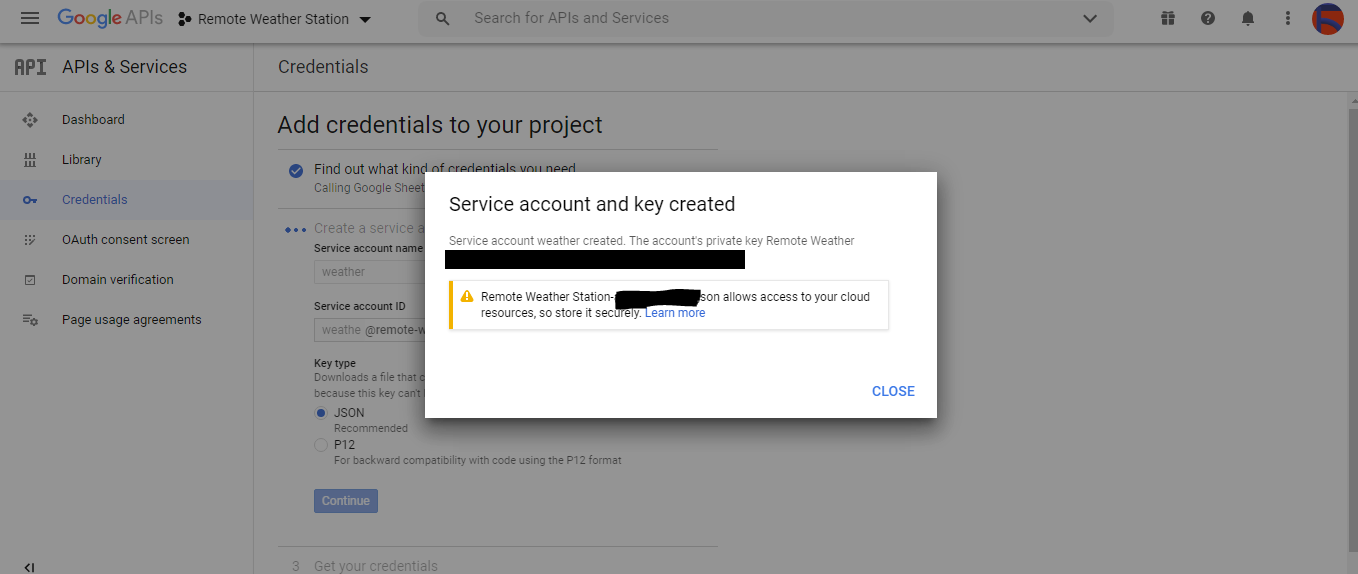
⭐プロジェクトダッシュボードを開き、クレデンシャルをクリックします ボタン。次に、以下のようにフォームに入力して、サービスアカウントとキーを作成します。
<図>
<図>
<図>
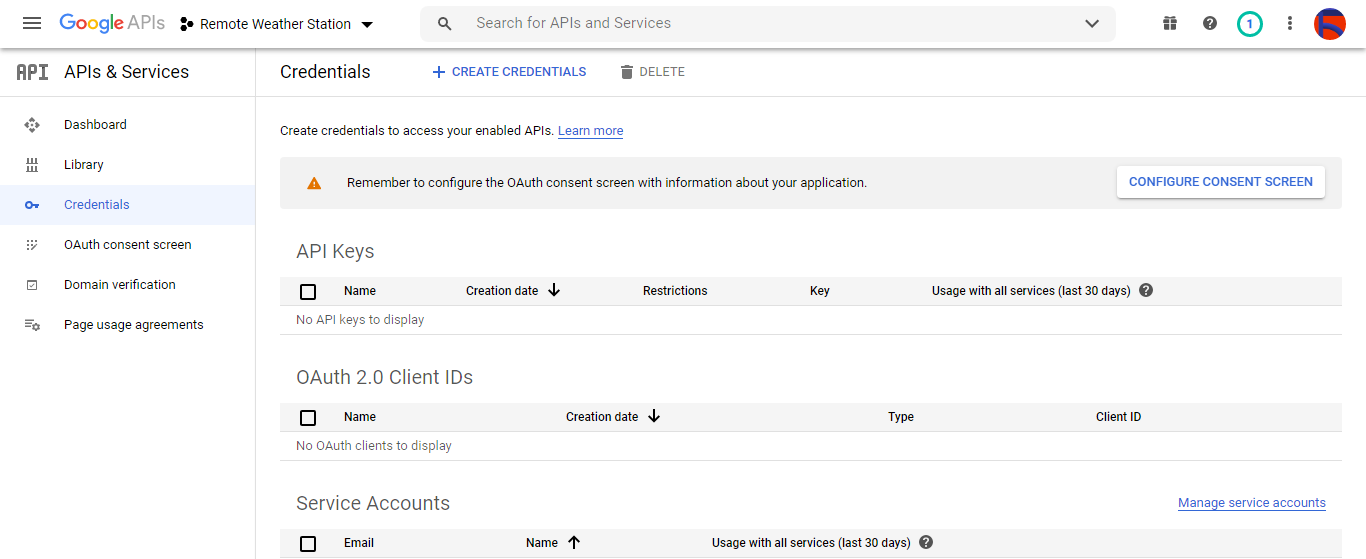
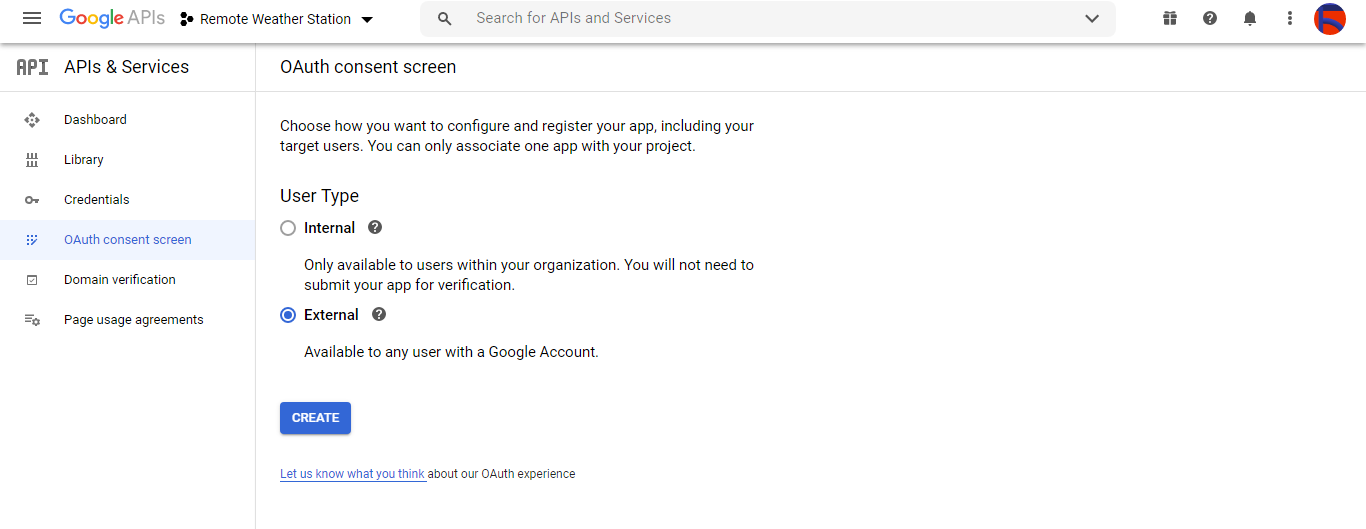
⭐ CREATE CREDENTIALS をクリックします ボタンをクリックし、OAuthクライアントIDを作成できるように同意画面を構成します。
<図>
<図>
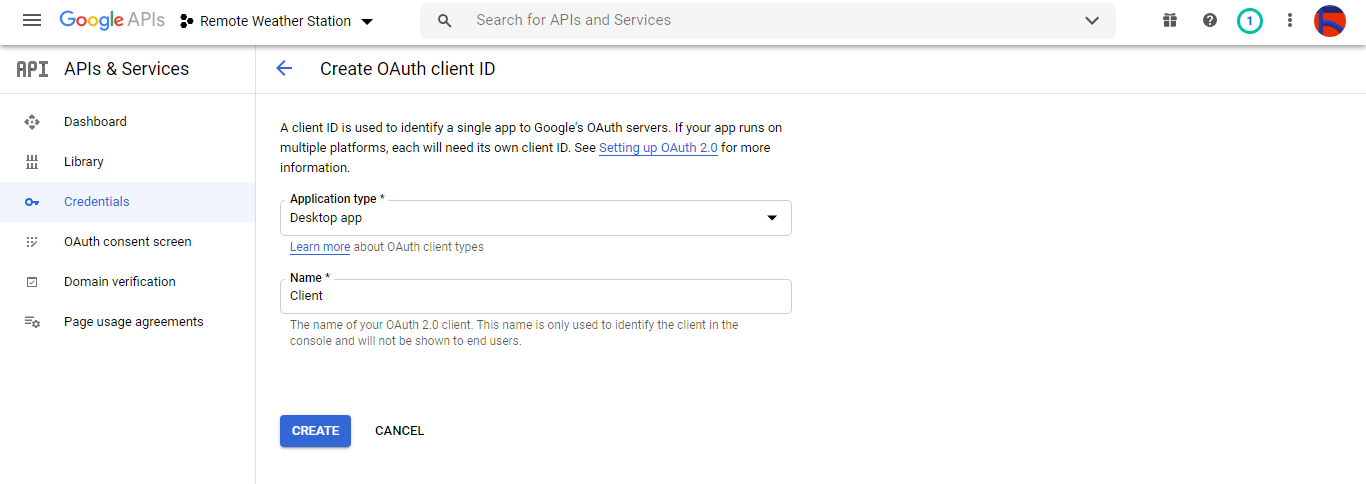
⭐次に、 Client という名前の新しいOAuthクライアントIDを作成します デスクトップアプリの下 (アプリケーションタイプ)。
<図>
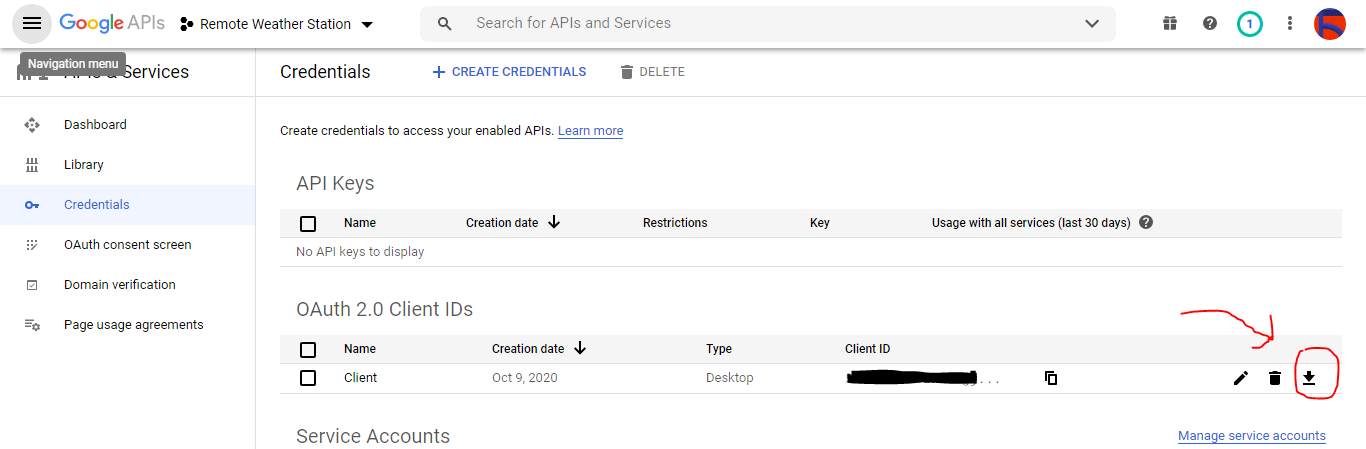
⭐OAuthクライアントIDを作成した後(クライアント) クレデンシャル(IDとシークレット)をダウンロードし、ファイルに credentials.json という名前を付けます。 。
<図>
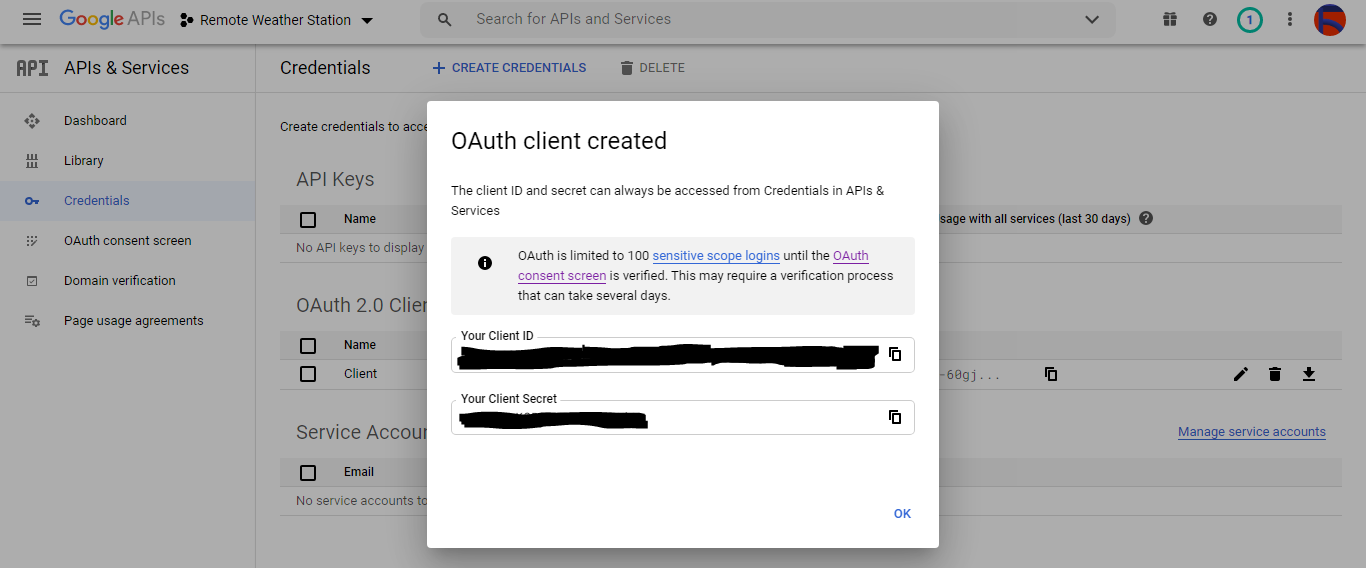
<図>
ステップ2.2:Googleスプレッドシートでスプレッドシートを作成する
⭐Googleスプレッドシートに移動し、個人を選択します 。
<図>

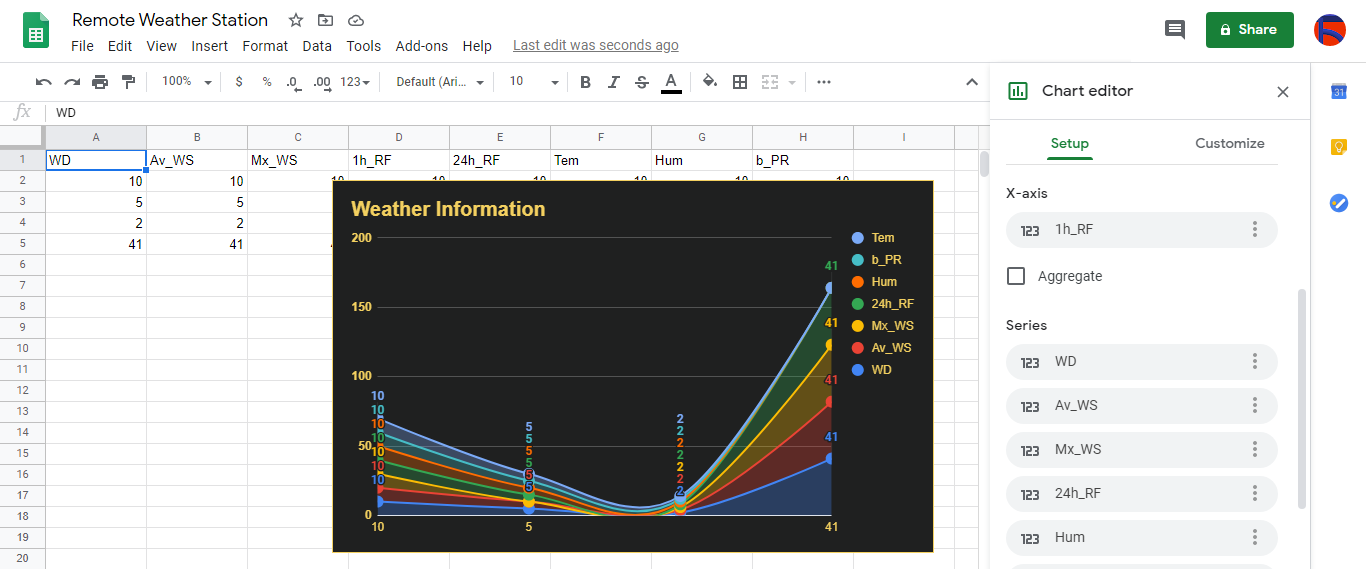
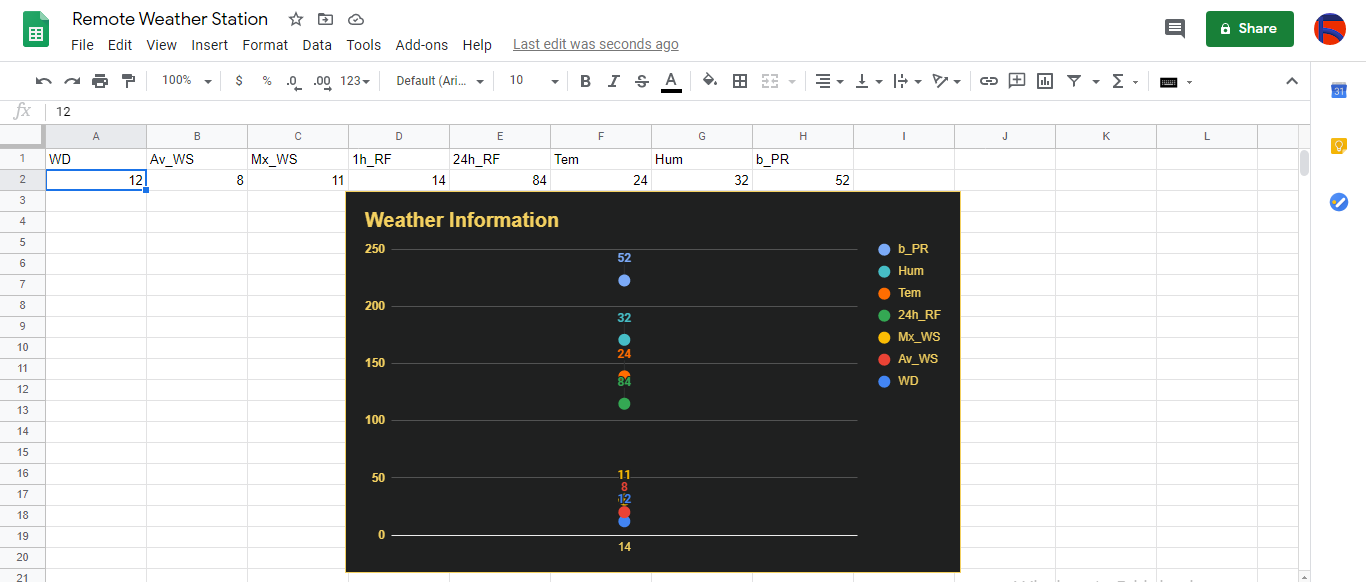
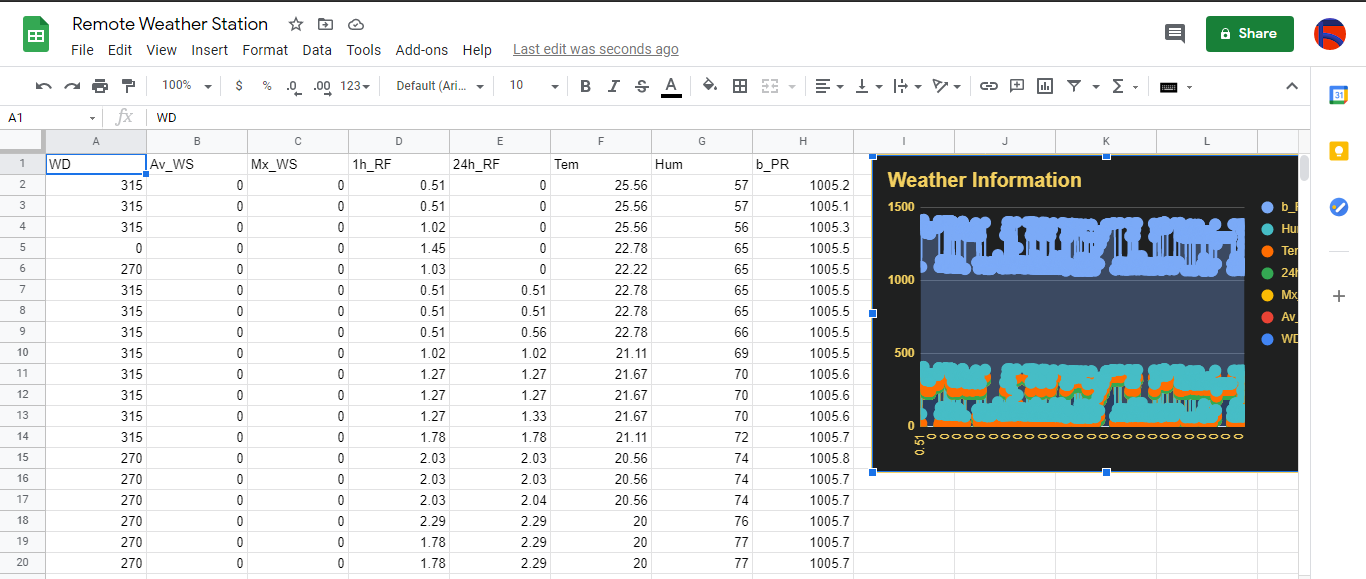
⭐空白を作成する スプレッドシートに名前を付けて Remote Weather Station 。
⭐次に、列名を最初の行として定義します。
- WD
- Av_WS
- Mx_WS
- 1h_RF
- 24h_RF
- テム
- ハム
- b_PR
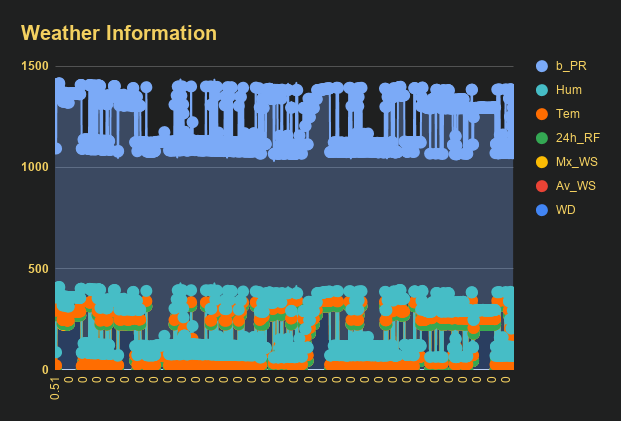
⭐必要に応じて、私と同様に、収集されたデータを検査するようにグラフを変更します。
<図>
ステップ3:スプレッドシートに気象データを追加するためのPHPでのWebアプリケーションの開発
このPHPWebアプリケーションは、開発ボード(ESP8266およびSIM808)によってHTTP Getリクエストを介して転送された気象データを取得し、検証済みの資格情報とトークンを使用して、そのデータをGoogleスプレッドシートの特定のスプレッドシート(ID)に追加するためのものです。
ウェブアプリケーションでは、PHP用のGoogleクライアントライブラリで、Googleスプレッドシートの特定のスプレッドシートに気象データを追加する必要があります。
⭐では、まず、 remote_weather_station という名前のフォルダを作成します サーバーにPHP用のGoogleクライアントライブラリをインストールします。
remote_weather_station フォルダには、機能するGoogleクライアントライブラリに加えて、次の4つのファイルが含まれている必要があります。
- index.php
- account_verification_token.php
- credentials.json (ステップ2.1)
- token.json (ステップ3.1)
このステップでは、最初の2つのファイル(index.phpとaccount_verification_token.php:
)について説明します。💻index.php
⭐Getリクエストを介して気象ステーションから地域の気象データを取得します:
//風向(wd)、平均風速(a_ws)、最大風速(m_ws)、1時間の降雨量(1_rf)、24時間の降雨量(24_rf)、温度(tem)、湿度(hum)、大気圧(b_pr)。
$ variables_from_module;
if(isset($ _ GET ['wd'])&&isset($ _ GET ['a_ws'])&&isset($ _ GET ['m_ws'] )&&isset($ _ GET ['1_rf'])&&isset($ _ GET ['24_rf'])&&isset($ _ GET ['tem'])&&isset($ _ GET ['hum'])&&isset($ _ GET ['b_pr'])){
$ variables_from_module =[
"wd" =>(int)$ _ GET ['wd']、
"a_ws" =>(float)$ _ GET ['a_ws']、
"m_ws" =>(float)$ _ GET ['m_ws']、
"1_rf" =>(float)$ _ GET ['1_rf']、
"24_rf" =>(float)$ _ GET ['24_rf']、
"tem" =>(float)$ _ GET ['tem']、
"hum" =>(int)$ _ GET ['hum']、
"b_pr" =>(float)$ _ GET ['b_pr']
];
} else {
$ variables_from_module =[
"wd" => "err"、
"a_ws" => "err"、
"m_ws" => "err"、
"1_rf" => "err"、
"24_rf" => "err"、
"tem" => "err"、
"hum" => "err"、
" b_pr "=>" err "
];
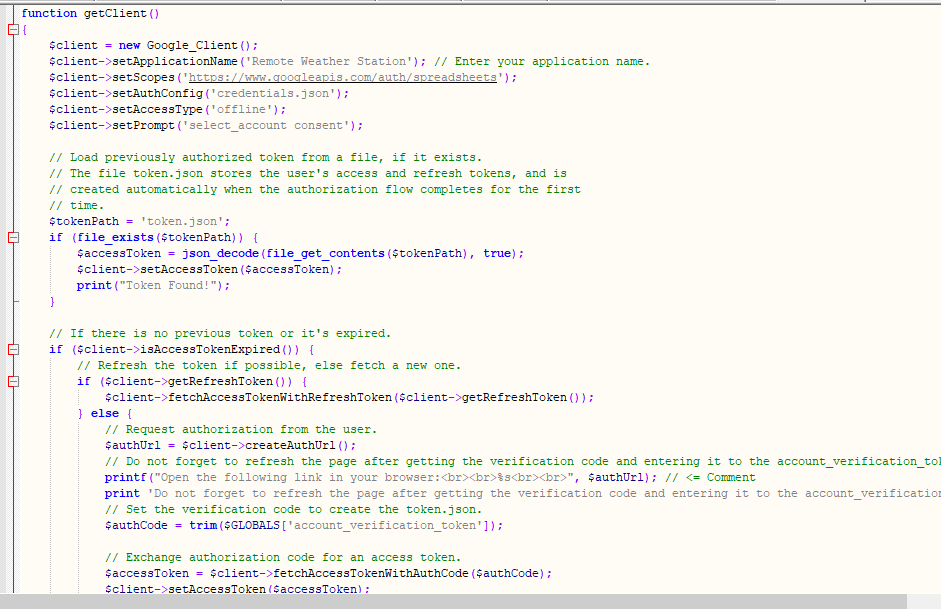
} ⭐ Remote Weather Station という名前のGoogleデベロッパーコンソールアプリケーションに接続します credentials.json を使用する ファイル(ステップ2.1) 。
  $ client =new Google_Client();
 $ client-> setApplicationName( 'Remote Weather Station'); //アプリケーション名を入力します。
 $ client-> setScopes( 'https://www.googleapis.com/auth/spreadsheets');
 $ client-> setAuthConfig( 'credentials.json');
 $ client-> setAccessType( 'offline');
 $ client-> setPrompt( 'select_accountconsent');
⭐ファイル( token.json )から以前に承認されたトークンをロードします )、存在する場合。
  $ tokenPath ='token.json';
 if(file_exists($ tokenPath)){
 $ accessToken =json_decode(file_get_contents($ tokenPath)、true);
 $ client-> setAccessToken($ accessToken);
 print( "Token Found!");
}
⭐以前のトークンがないか、期限切れの場合は、ユーザーに認証をリクエストし、確認コードを設定して token.json を作成します file_put_contents()を含むファイル 機能。
if($ client-> isAccessTokenExpired()){
//可能であればトークンを更新し、そうでない場合は新しいトークンをフェッチします。
if($ client-> getRefreshToken()){
$ client-> fetchAccessTokenWithRefreshToken($ client-> getRefreshToken());
} else {
//ユーザーに承認をリクエストします。
$ authUrl =$ client-> createAuthUrl ();
...
//検証コードを設定してtoken.jsonを作成します。
$ authCode =Trim($ GLOBALS ['account_verification_token' ]);
...
//エラーが発生し、account_verification_tokenが入力されているかどうかを確認します。
if(array_key_exists( 'error'、 $ accessToken)){
throw new Exception(join( '、'、$ accessToken));
} else {
print( "Successful!Refresh the page。");
}
}
//トークンをファイルに保存します。
if(!file_exists(dirname($ tokenPat h))){
mkdir(dirname($ tokenPath)、0700、true);
}
file_put_contents($ tokenPath、json_encode($ client-> getAccessToken()));
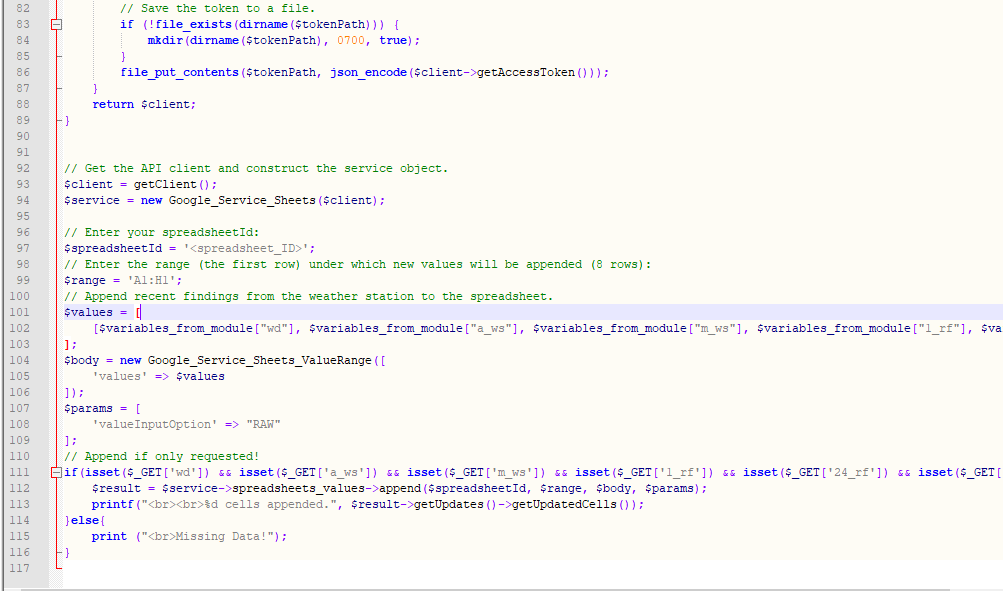
} ⭐スプレッドシートIDと範囲を入力して、気象観測所からの最近の調査結果をスプレッドシートに追加します。
https://docs.google.com/spreadsheets/d/spreadsheetId/edit#gid=0
  //スプレッドシートIDを入力してください:
 $ SpreadsheetId ='';
 //新しい値が追加される範囲(最初の行)を入力してください(8行) :
 $ range ='A1:H1';
 //ウェザーステーションからの最近の調査結果をスプレッドシートに追加します。
 $ values =[
 [$ variables_from_module ["wd" 。 $ variables_from_module ["b_pr"]]
];
 $ body =new Google_Service_Sheets_ValueRange([
 'values' => $ values
]);
 $ params =[
 'valueInputOption' => "RAW"
];

 ...

 $ result =$ service-> Spreadsheets_values-> append( $ SpreadsheetId、$ range、$ body、$ params);
 printf( "

%dセルが追加されました。"、$ result-> getUpdates()-> getUpdatedCells()); >
💻account_verification_token.php
⭐作成された AuthUrl によってWebアプリケーションを承認した後 、指定された確認コードを入力して、アクセストークンを設定します。
$ account_verification_token =""; //認証後に確認コードを入力します。 <図>
<図>
ステップ3.1:Raspberry Pi(または任意のサーバー)でのWebアプリケーションのセットアップ
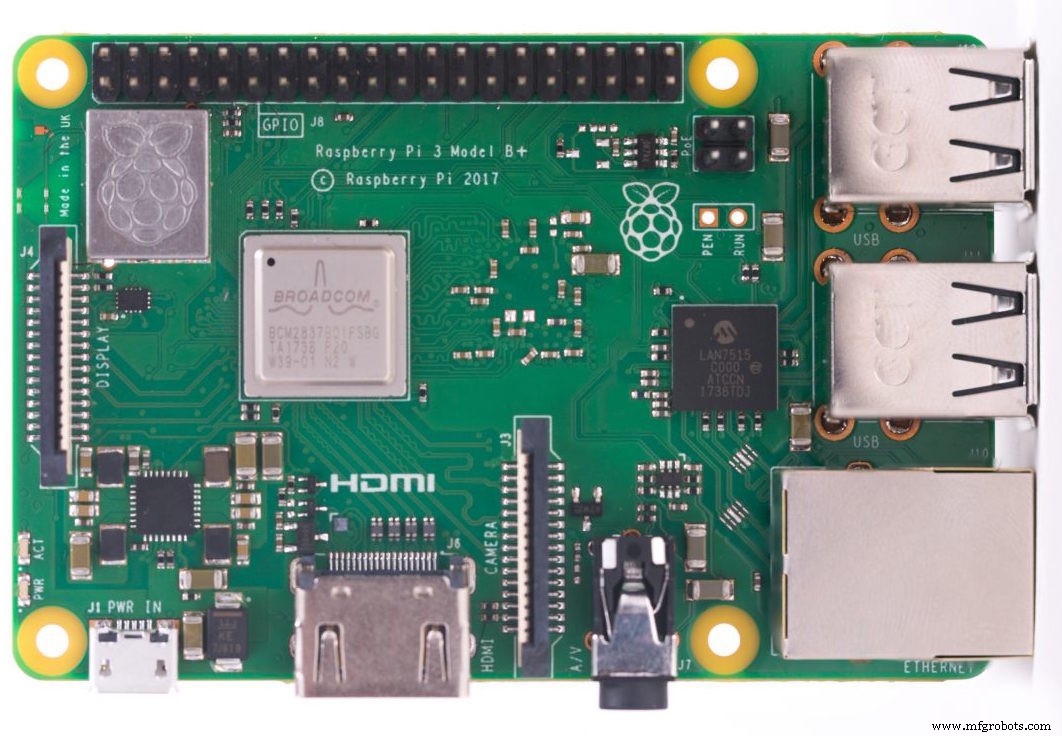
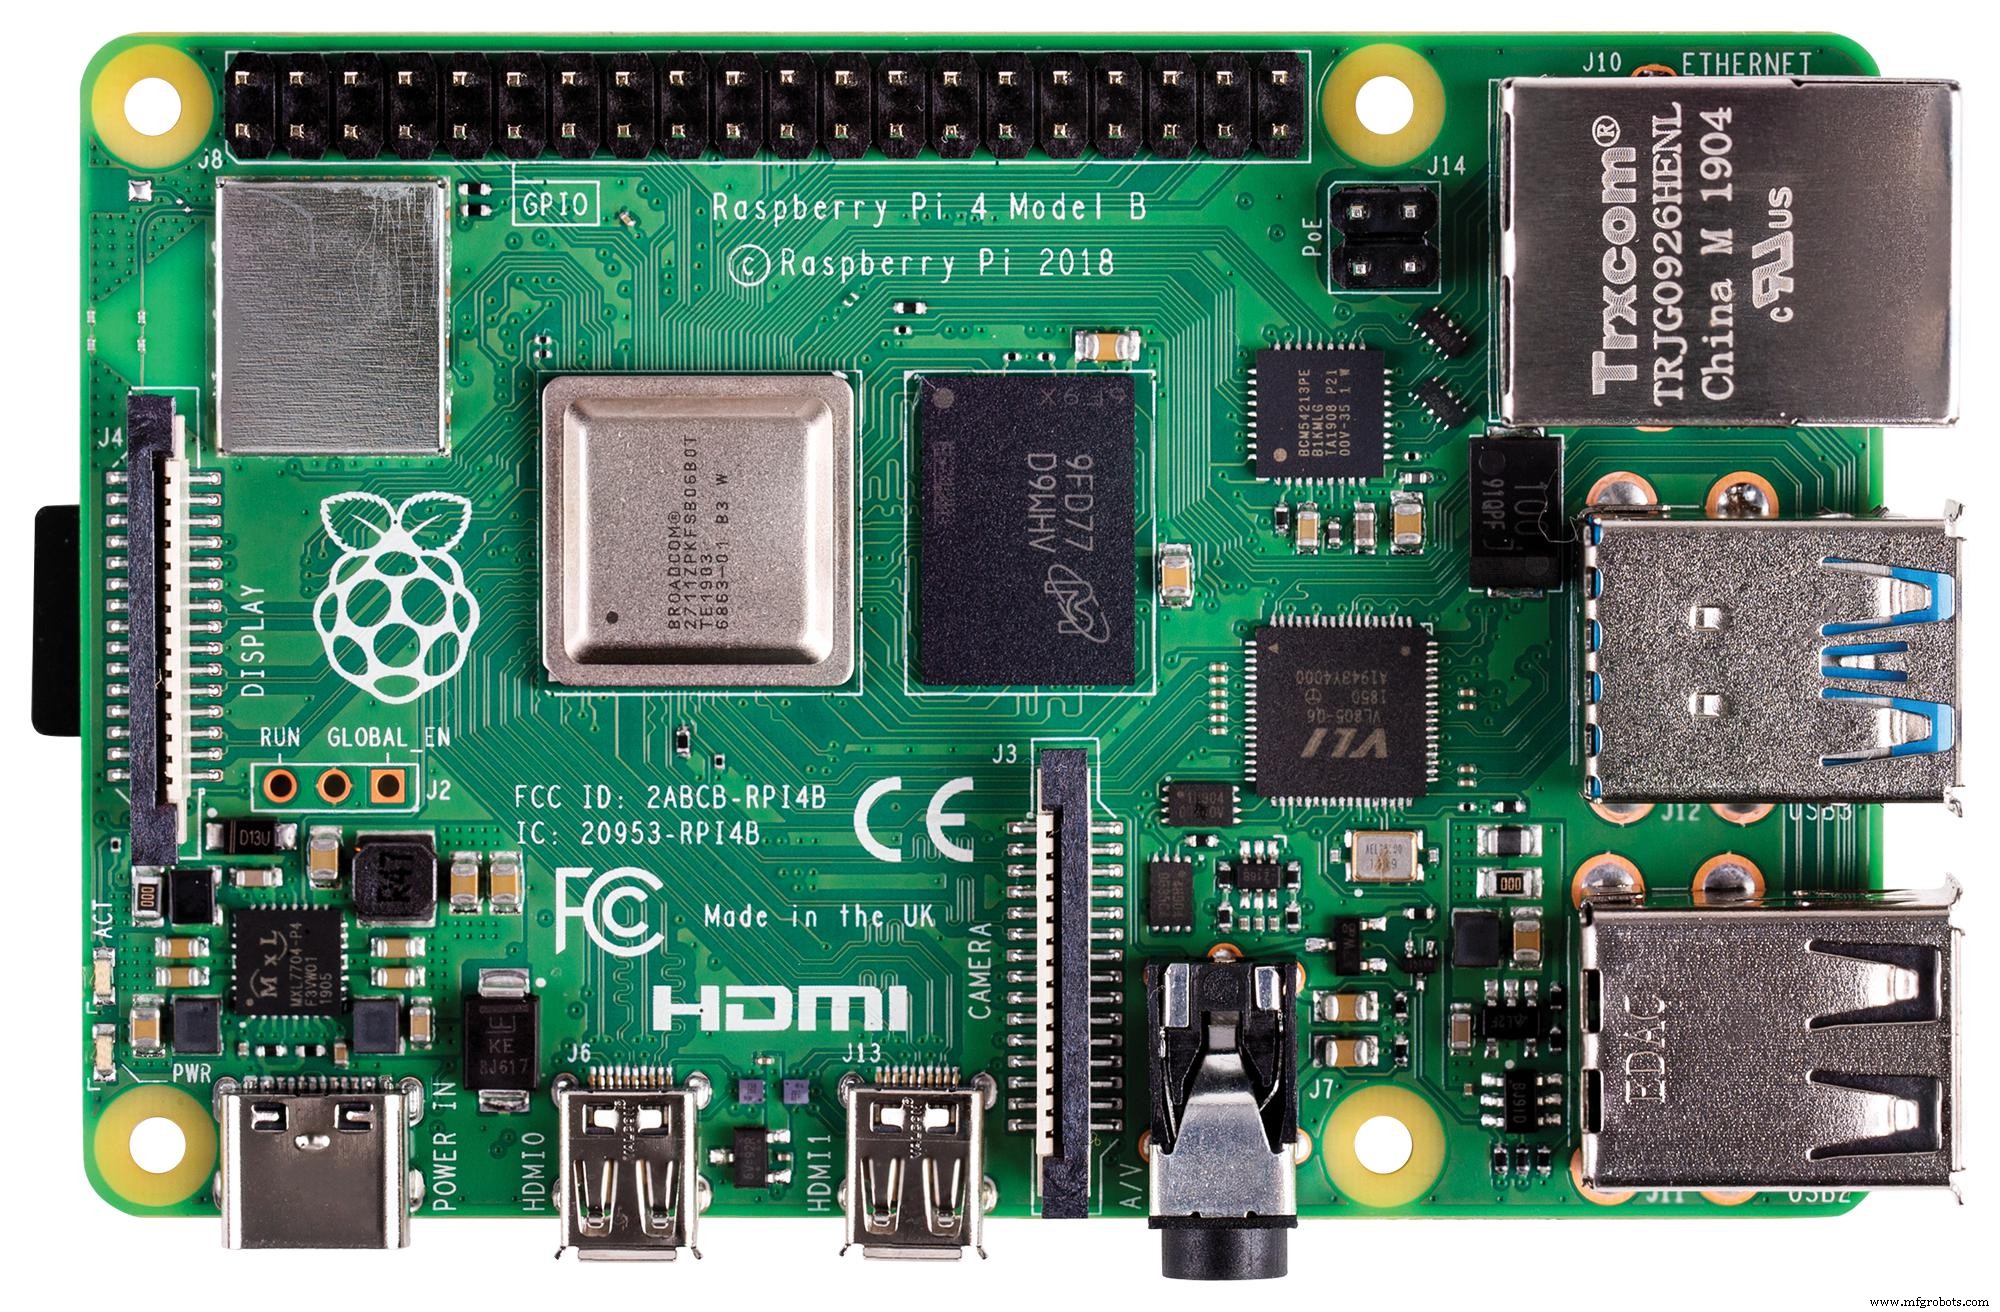
PHP Webアプリケーションを作成した後、Raspberry Piで実行することにしましたが、PHPサーバーであれば、どのサーバーでもアプリケーションを実行できます。
Raspberry Piを使用したいが、RaspberryPiでLAMPWebサーバーをセットアップする方法がわからない場合は、このチュートリアルを調べることができます。
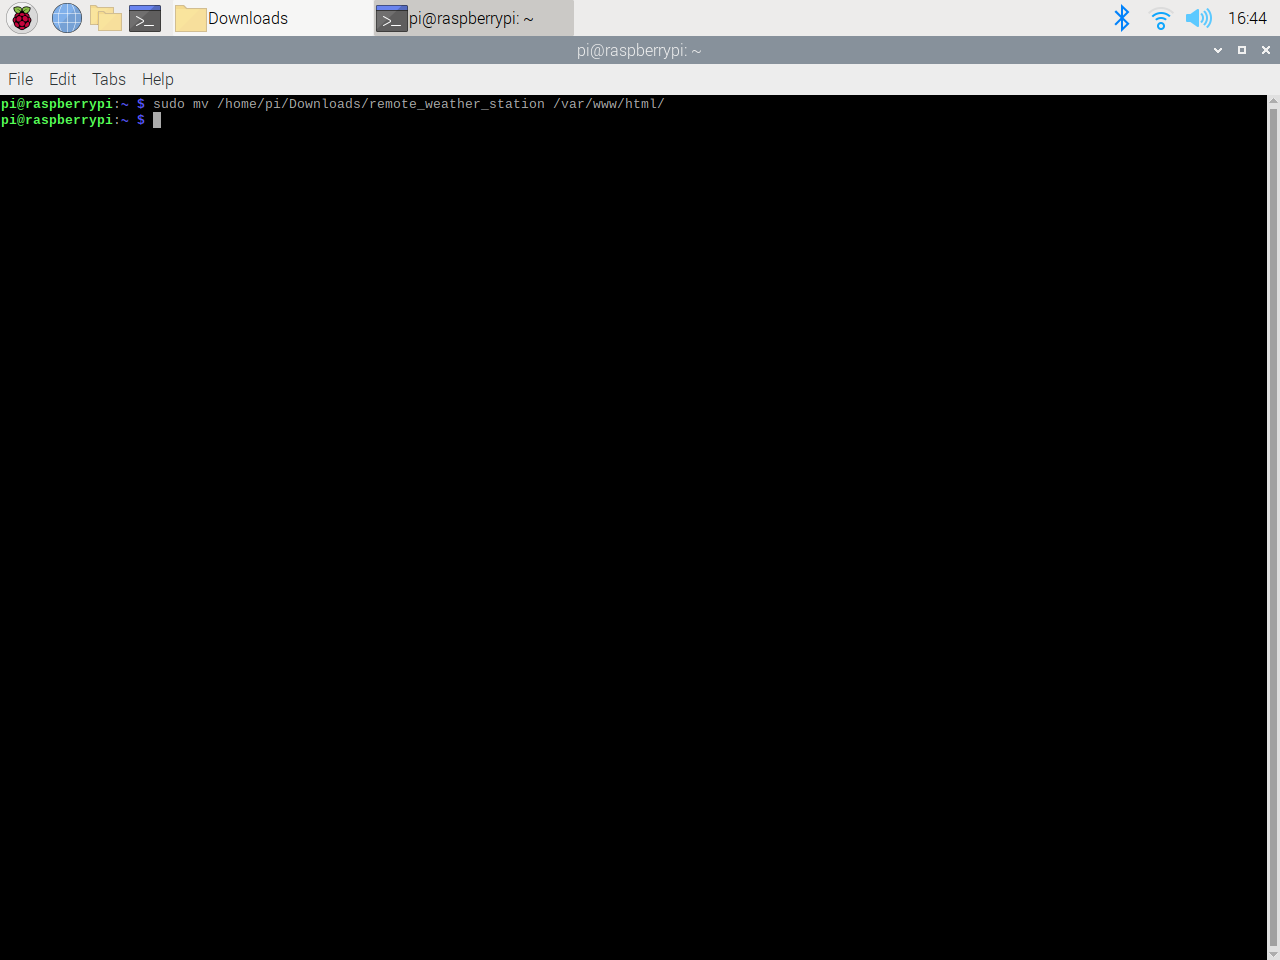
⭐まず、Apacheサーバーは保護された場所であるため、ターミナルを使用してアプリケーションフォルダー(remote_weather_station)をApacheサーバー(/ var / www / html)に移動します。
sudo mv / home / pi / Downloads / remote_weather_station / var / www / html /
<図>
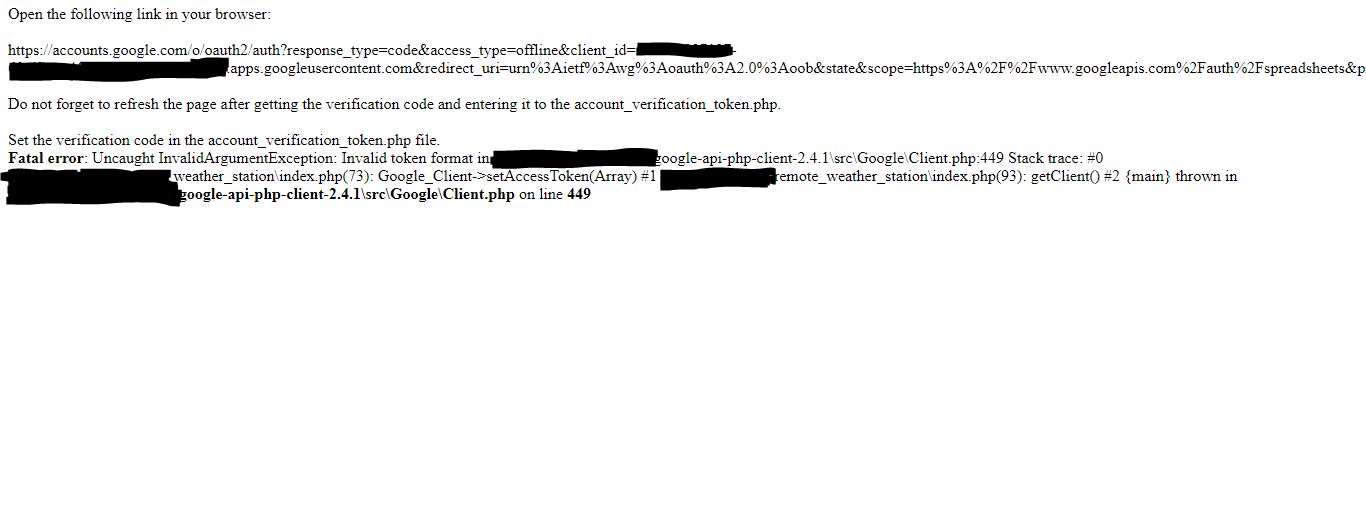
⭐検証コードがないため、Webアプリケーションを初めて開いたときにエラーがスローされます。確認コードを取得するには、アプリケーションによって生成された認証リンクに移動します。
<図>
⭐次に、[リモート気象台に移動(安全ではない)]をクリックします。 。
<図>
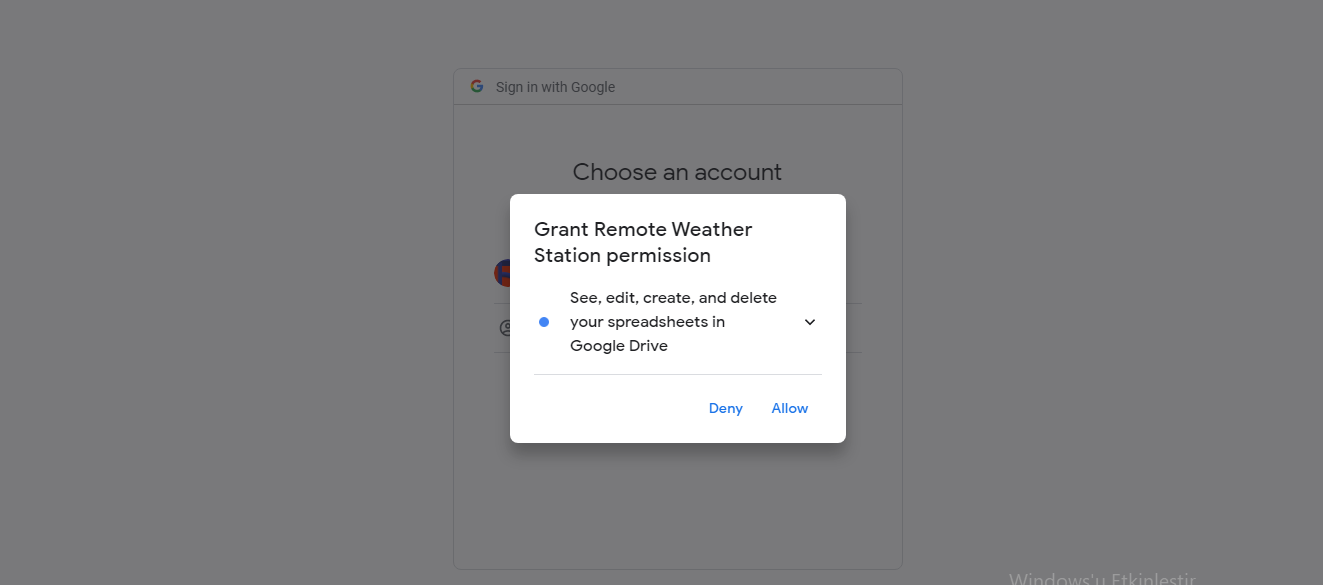
⭐必要な権限をアプリケーションに付与します。
<図>
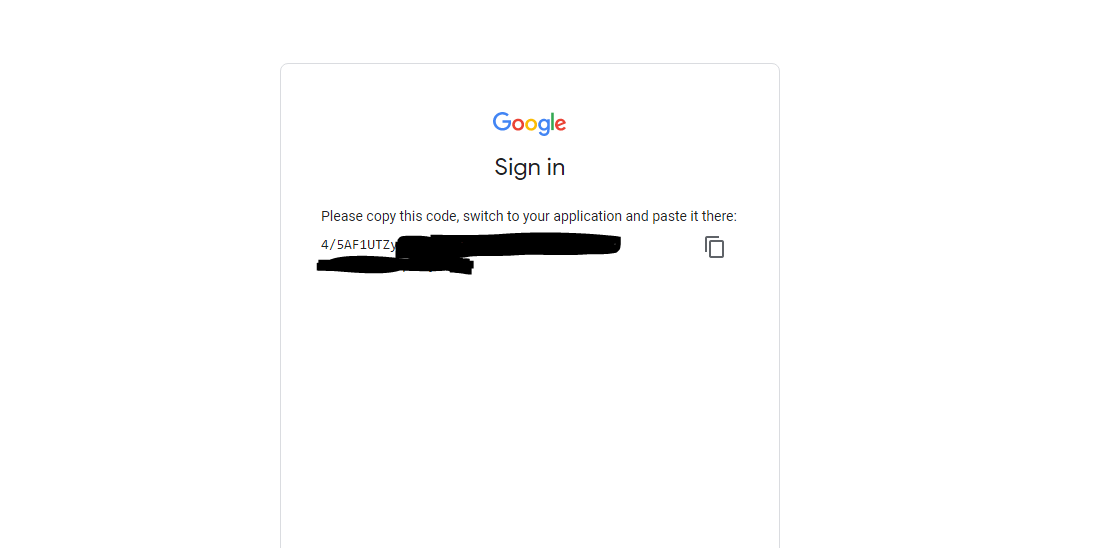
⭐ここで、確認コードをコピーして account_verification_token.php に貼り付けます。 。
<図>
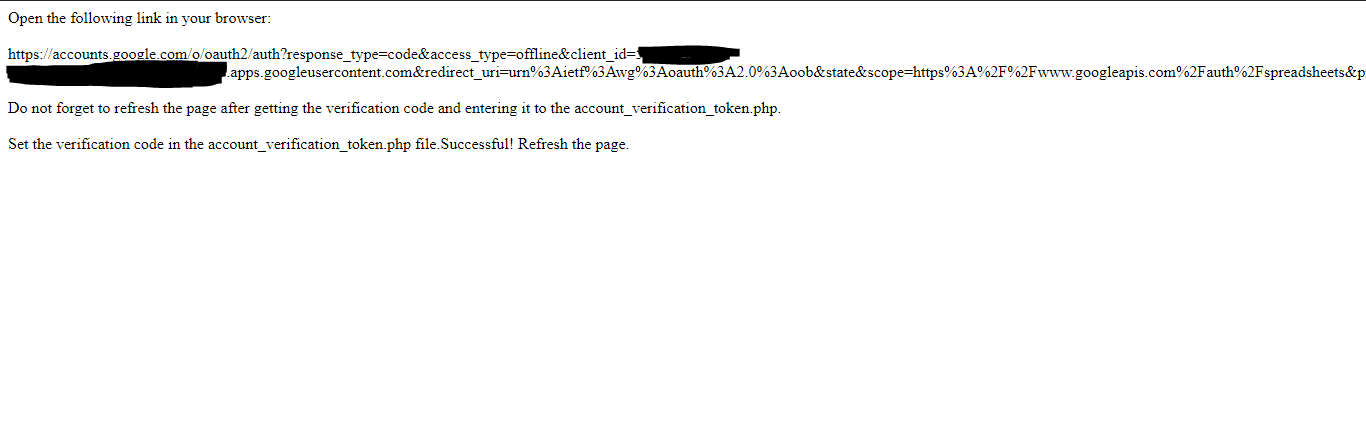
⭐Webアプリケーションに戻ります。確認メッセージが表示されます:成功しました!ページを更新する 。
<図>
⭐ページを更新した後、Webアプリケーションは検証コードを使用してアクセストークンを取得し、アクセストークンを token.json という名前のファイルに保存します。 。したがって、エラーが再度スローされることはありません。
<図>

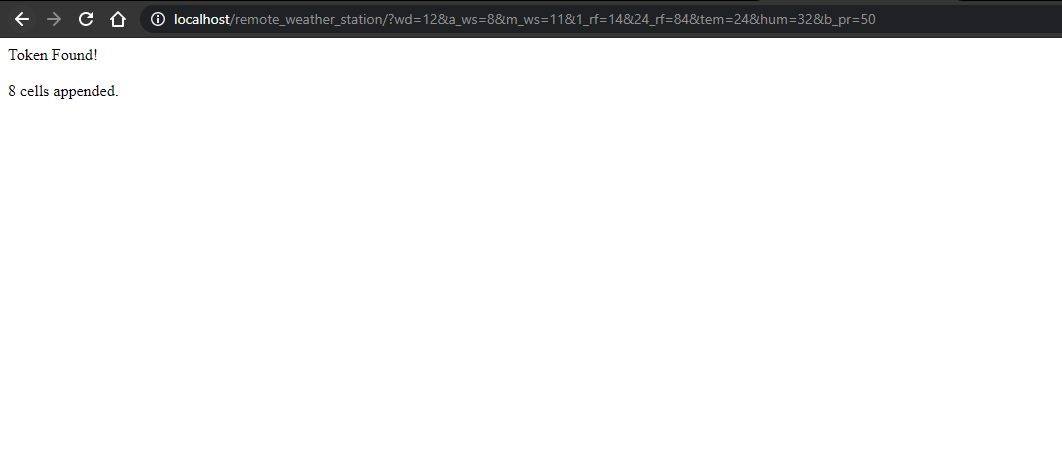
⭐PHPWebアプリケーションが指定されたスプレッドシートに新しいデータを正確に追加しているかどうかをテストするには:
http:// localhost / remote_weather_station /?wd =12&a_ws =8&m_ws =11&1_rf =14&24_rf =84&tem =24&hum =32&b_pr =57
<図>
<図>
ステップ4:ESP8266(WiFi)を使用した気象データの読み取りと送信
バルコニーで気象データを収集するために、気象ステーションでNodeMCU ESP-12E(ESP8266)開発ボードを使用しました。
5分ごとに天気データをPHPWebアプリケーションに送信するようにプログラムしました。
<図>

⭐必要なライブラリを含め、WiFi設定を定義します。
  #include
 #include
 #include
 #include
 #include

 // WiFi設定を定義します。
 const char * ssid ="";
 const char * password =" ";
⭐気象観測所の設定とシリアル接続ピンを定義します-D6、D5。
  //気象観測所の設定を定義します:
 char databuffer [35];
 double temp;
 int transfer =0;

 //定義シリアル接続ピン-RXおよびTX。
 SoftwareSerial Serial_1(D6、D5); //(Rx、Tx)
⭐ getBuffer()内 関数、気象ステーションからデータを取得します。
void getBuffer(){
int index;
for(index =0; index <35; index ++){
if(Serial_1.available()){
databuffer [index] =Serial_1.read();
if(databuffer [0]!='c'){
index =-1;
}
}
else {
インデックス-;
}
}
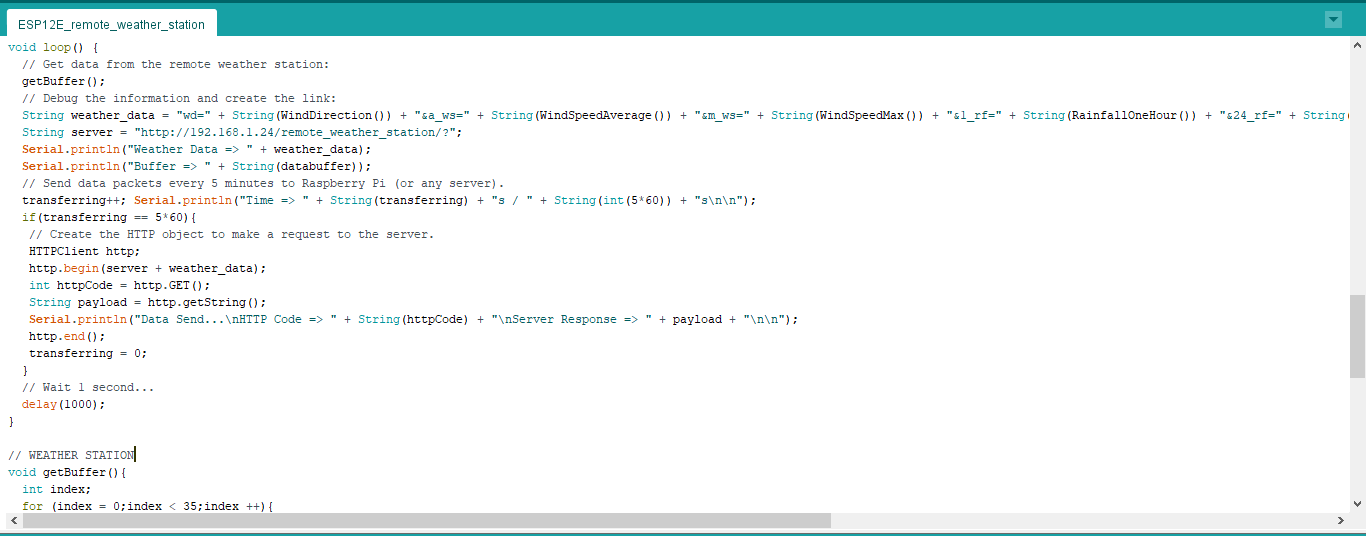
} ⭐気象データをデバッグし、リンクを作成します。
  String Weather_data ="wd =" + String(WindDirection())+ "&a_ws =" + String(WindSpeedAverage())+ "&m_ws =" + String(WindSpeedMax())+ "&1_rf =" + String(RainfallOneHour())+ "&24_rf =" + String(RainfallOneDay())+ "&tem =" + String(Temperature())+ "&hum =" + String(Humidity())+ "&b_pr =" + String( BarPressure());
 String server ="http://192.168.1.24/remote_weather_station/?";

 ...

 int WindDirection(){ transCharToInt(databuffer、1,3);を返します。 } //風向(度)

 float WindSpeedAverage(){temp =0.44704 * transCharToInt(databuffer、5,7);温度を返す; } //平均対気速度(1分)

 float WindSpeedMax(){temp =0.44704 * transCharToInt(databuffer、9,11);温度を返す; } //最大風速(5分)

 float Temperature(){temp =(transCharToInt(databuffer、13,15)-32.00)* 5.00 / 9.00;温度を返す; } //温度( "C")

 float RainfallOneHour(){temp =transCharToInt(databuffer、17,19)* 25.40 * 0.01;温度を返す; } //降雨(1時間)

 float RainfallOneDay(){temp =transCharToInt(databuffer、21,23)* 25.40 * 0.01;温度を返す; } //降雨量(24時間)

 int Humidity(){return transCharToInt(databuffer、25,26); } //湿度(%)

 float BarPressure(){temp =transCharToInt(databuffer、28,32);戻り温度/10.00; } //気圧(hPA)
⭐5分ごとにRaspberryPi(または任意のサーバー)にデータパケットを送信します。
  transferring ++; Serial.println( "Time =>" + String(transferring)+ "s /" + String(int(5 * 60))+ "s \ n \ n");
 if(transferring ==5 * 60){
 //サーバーにリクエストを送信するHTTPオブジェクトを作成します。
 HTTPClient http;
 http.begin(server + Weather_data);
 int httpCode =http.GET();
文字列ペイロード=http.getString();
 Serial.println( "データ送信... \ nHTTPコード=>" + String(httpCode)+ "\ nサーバー応答=>" +ペイロード+ "\ n \ n");
 http.end();
転送=0;
}
 // 1秒待ちます...
 delay(1000);
<図>
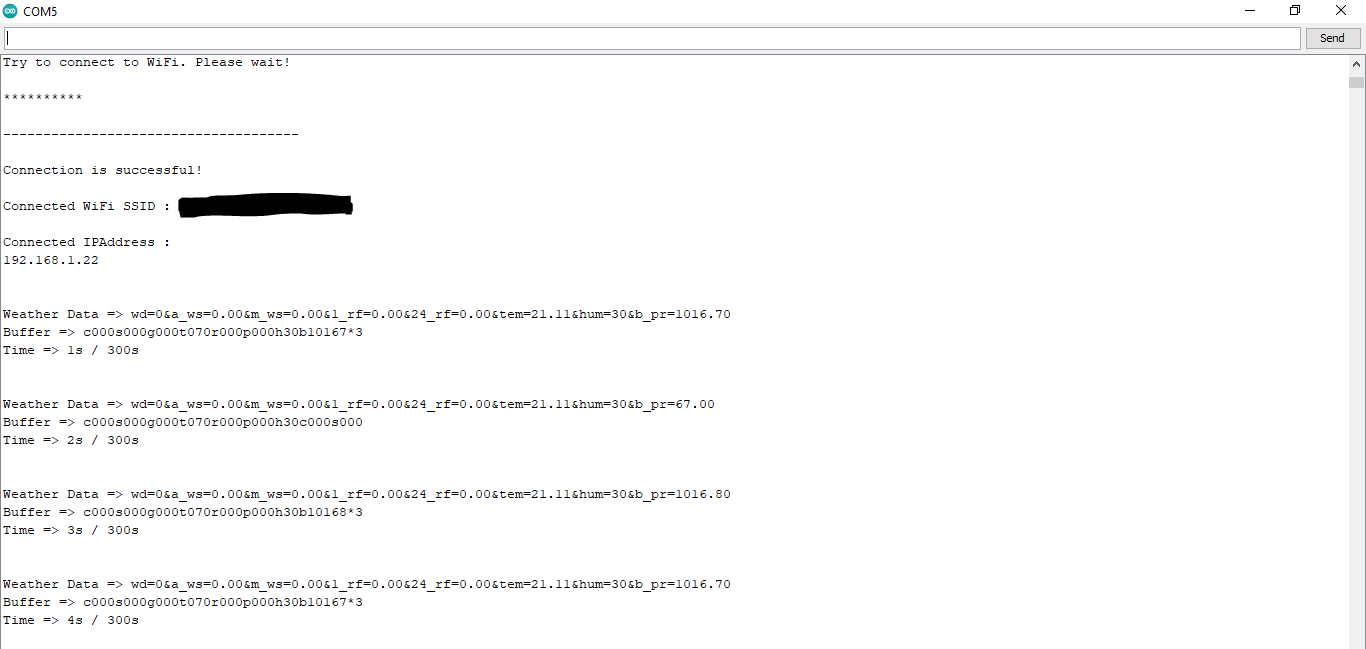
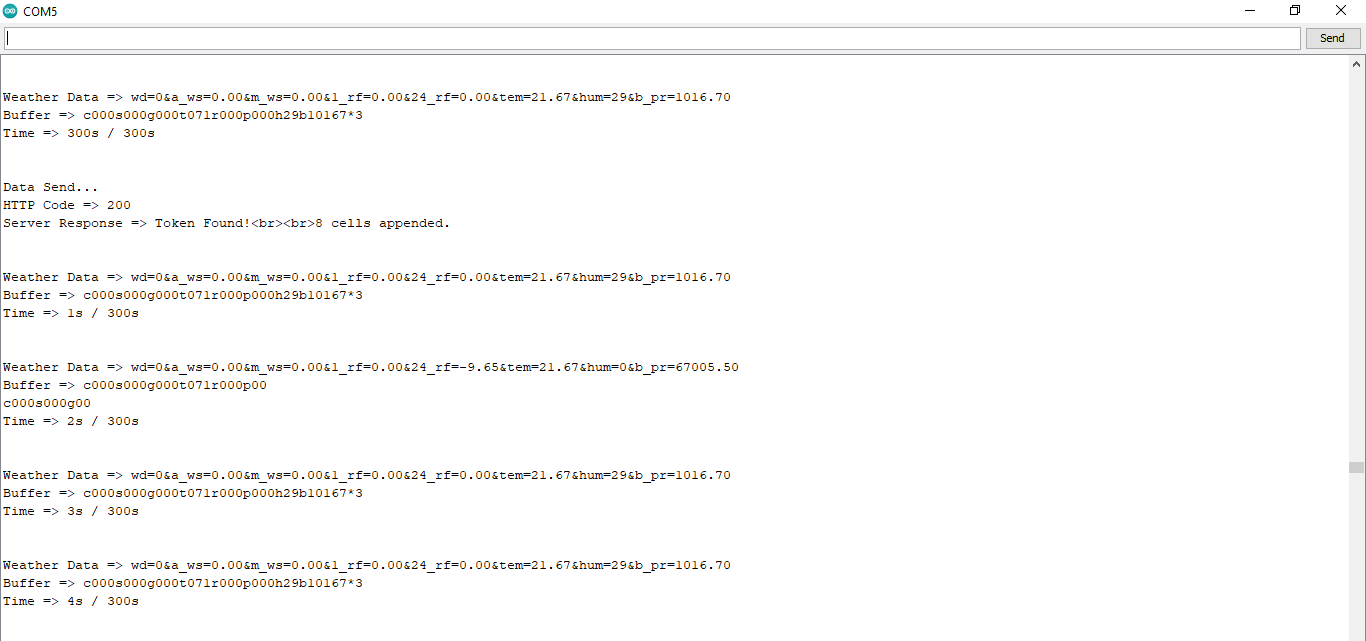
⭐コードをNodeMCUESP-12E(ESP8266)開発ボードにアップロードした後、シリアルモニターに毎秒気象データを表示し、5分(300秒)ごとにデータパケットをPHPWebアプリケーションに送信します。
 接続に成功しました!

 ...

気象データ=> wd =0&a_ws =0.00&m_ws =0.00&1_rf =0.00&24_rf =0.00&tem =21.67 &hum =29&b_pr =1016.70
 Buffer => c000s000g000t071r000p000h29b10167 * 3
 Time => 299s / 300s


 Weather Data => wd =0&a_ws =0.00&m_ws =0.00&1_rf =0.00&24_rf =0.00&tem =21.67&hum =29&b_pr =1016.70
バッファ=> c000s000g000t071r000p000h29b10167 * 3
時間=> 300秒/ 300秒

 ...
⭐次に、サーバーからの応答が表示されます。
  ...

データ送信...
 HTTPコード=> 200
サーバー応答=>トークンが見つかりました!

 8つのセルが追加されました。

 ...
<図>
<図>
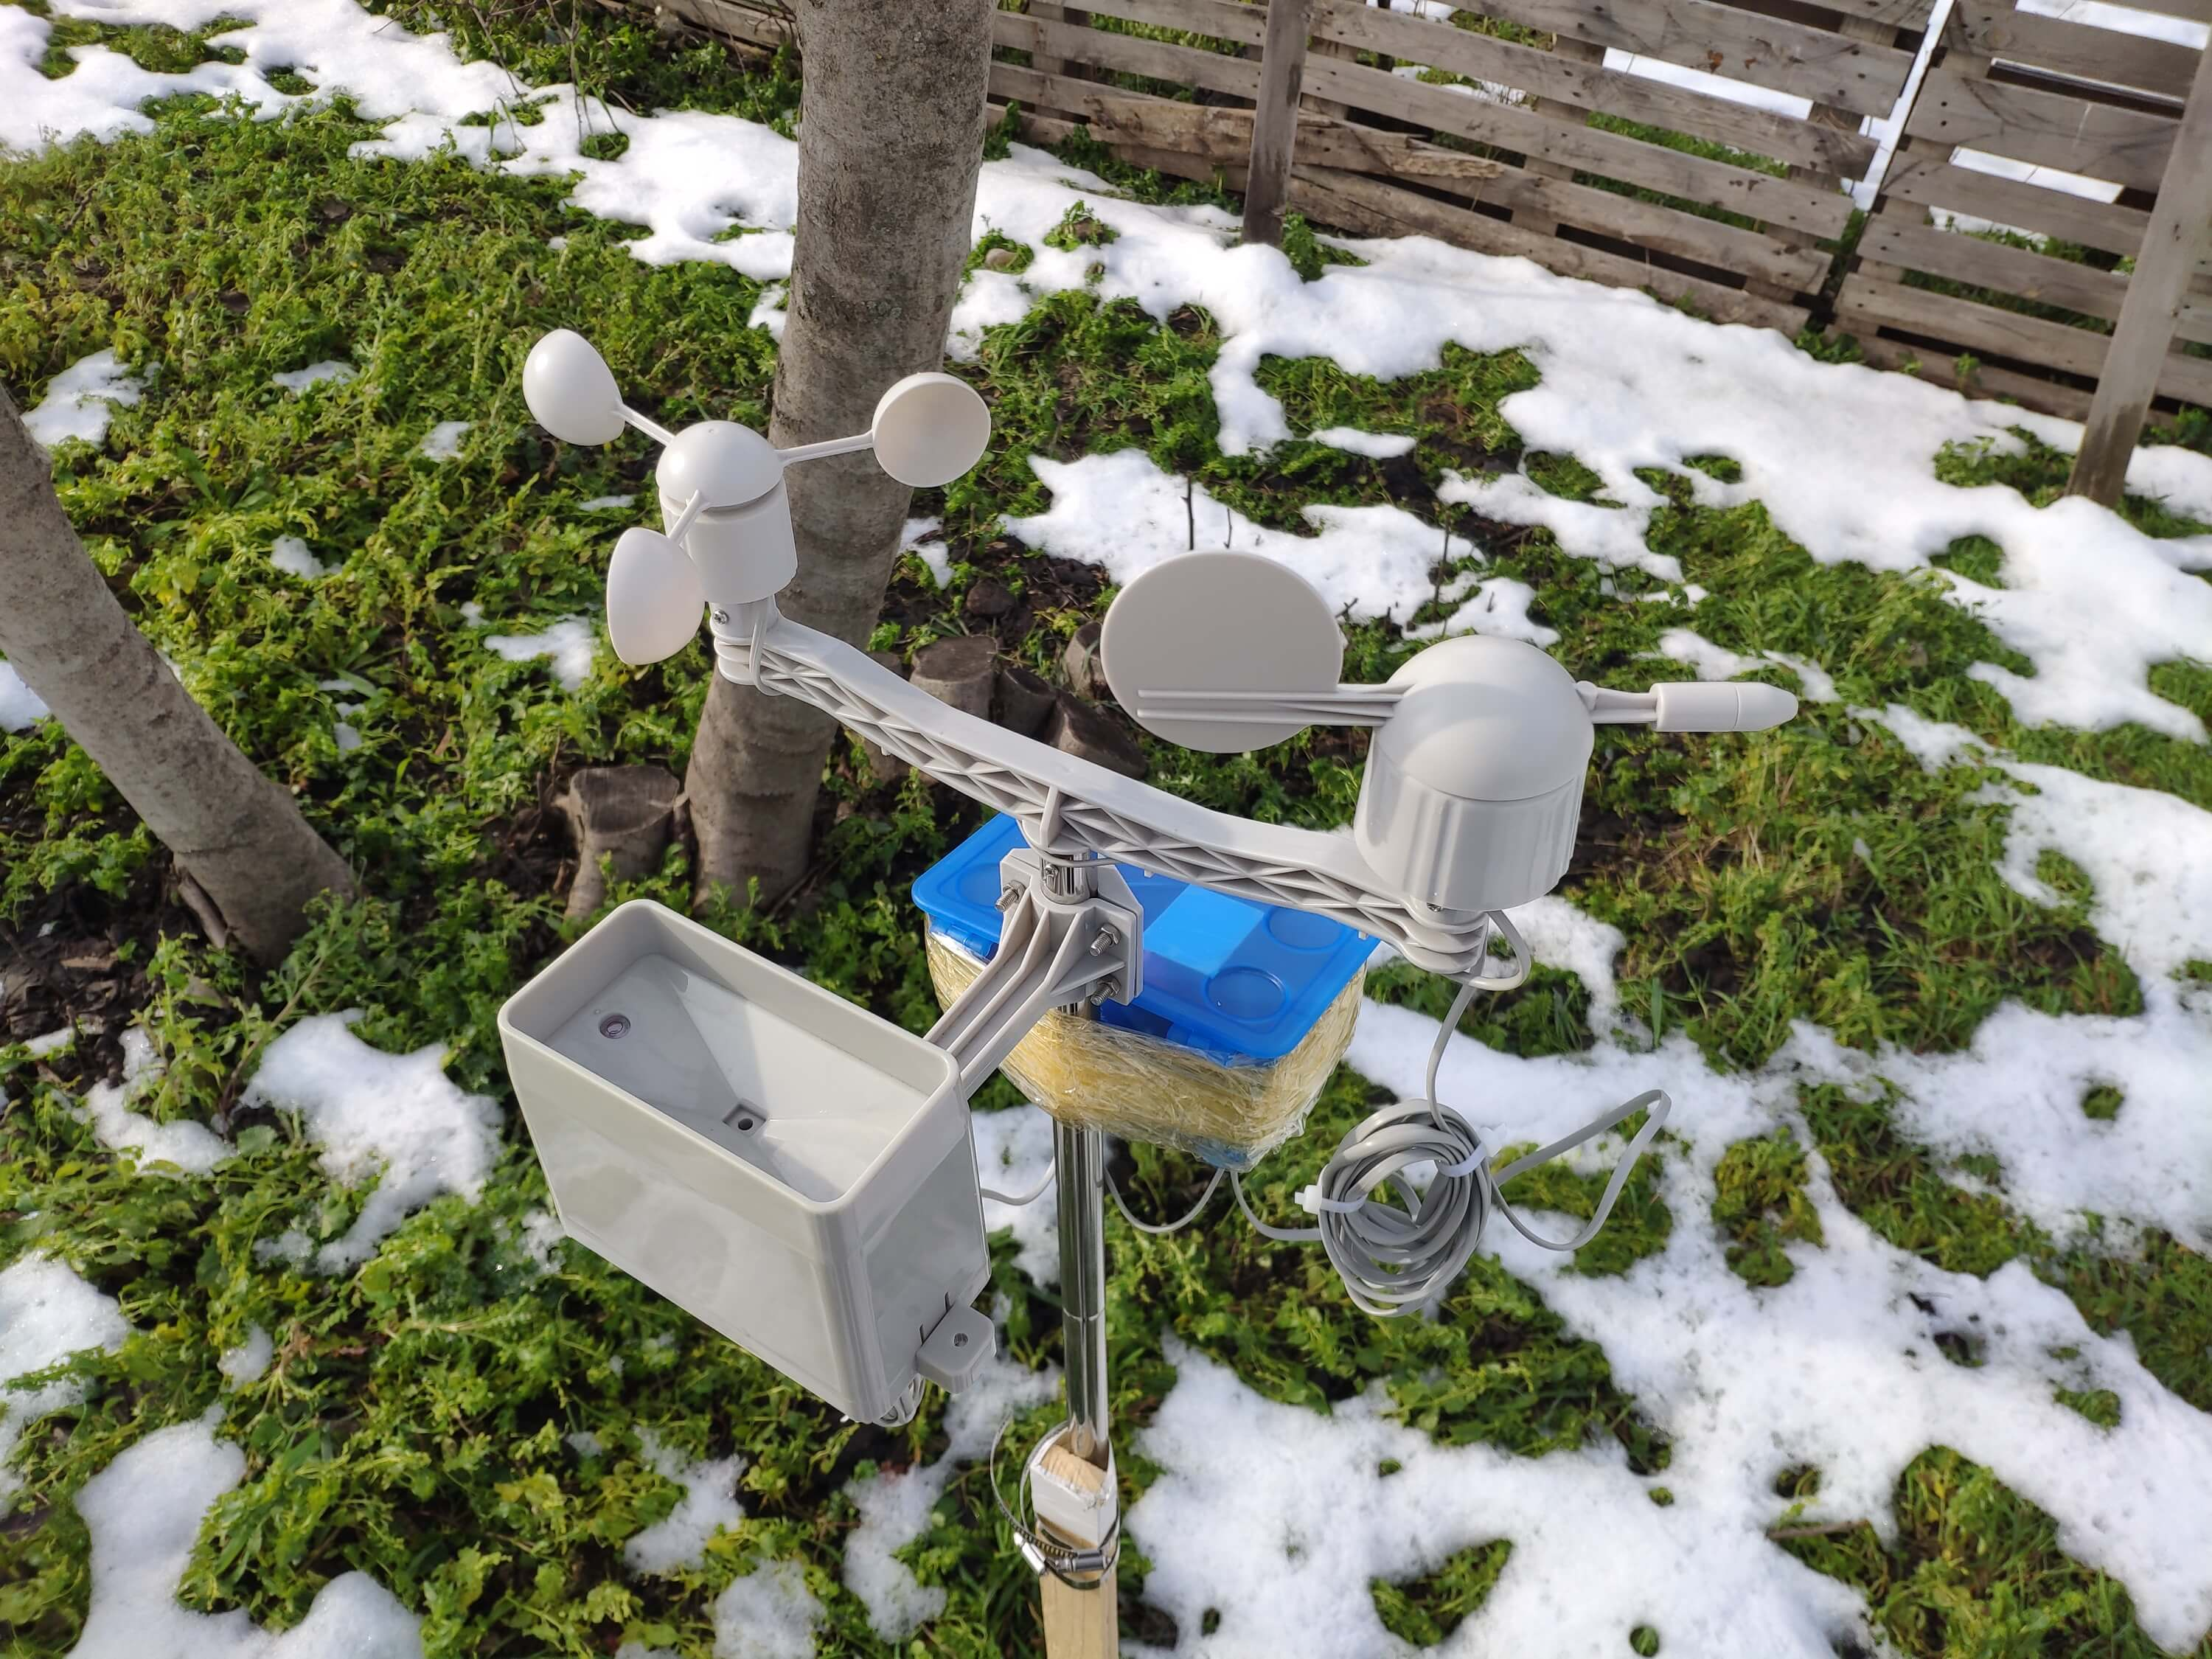
ステップ4.1:SIM808(GPRS)を使用した気象データの読み取りと送信
裏庭で気象データを収集するために、気象観測所とルーターの間の距離が遠すぎる場合は、ArduinoUnoにSIM808シールドを使用しました。
以下の部分を除いて、ほとんどのコードは同じであり、前のステップでカバーされています。
<図>
⭐必要なライブラリを含め、sim808オブジェクトを定義します。
SIM808 GPS / GPRS / GSMシールド用|ダウンロード
  #include
 #include

 // sim808を定義します。
 DFRobot_SIM808 sim808(&Serial);
⭐SIM808モジュールを初期化し、正しく機能している場合は続行します。
  // ******** sim808モジュールを初期化します*************
 while(!sim808.init()){
 delay(1000);
 Serial.print( "Sim808 init error \ r \ n");
}
 delay(2000);
 // SIM808モジュールが正確に機能しています。
 Serial.println( "Sim808 init success");
 delay(5000);
⭐TCP接続を確立してGETリクエストを行うことにより、5分ごとにサーバーにデータパケットを送信します。
transferring ++; Serial.println( "Time =>" + String(transferring)+ "s /" + String(int(5 * 60))+ "s \ n \ n");
if(transferring ==5 * 60){
// *********** DHCPを試行します*******************
while(!sim808。 join(F( "cmnet"))){
Serial.println( "Sim808 join network error!");
delay(2000);
}
// ** **********成功したDHCP ****************
delay(5000);
Serial.println( "Successful DHCP");
// *********** TCP接続を確立します************
if(!sim808.connect(TCP、 "192.168。 1.24 "、80)){//サーバーで変更します。
Serial.println("接続エラー ");
} else {
Serial.println("接続OK ");
}
delay(2000);
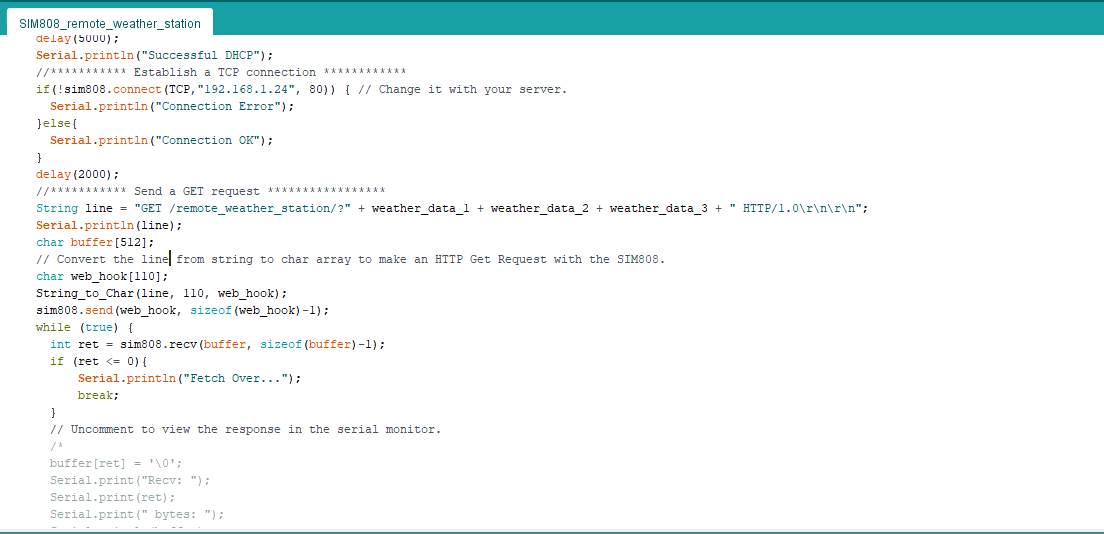
... ⭐行文字列を作成したら、それを文字列からchar配列に変換して、SIM808でHTTPGetリクエストを作成します。
  ...

 String line ="GET / remote_weather_station /?" + Weather_data_1 + Weather_data_2 + Weather_data_3 + "HTTP / 1.0 \ r \ n \ r \ n";
 Serial.println(line);
 char buffer [512];
 //変換文字列からchar配列への行で、SIM808を使用してHTTPGetリクエストを作成します。
 char web_hook [110];
 String_to_Char(line、110、web_hook);
 sim808.send(web_hook、sizeof (web_hook)-1);
 while(true){
 int ret =sim808.recv(buffer、sizeof(buffer)-1);
 if(ret <=0){
 Serial.println( "Fetch Over ...");
 break;
}

 ...
<図>
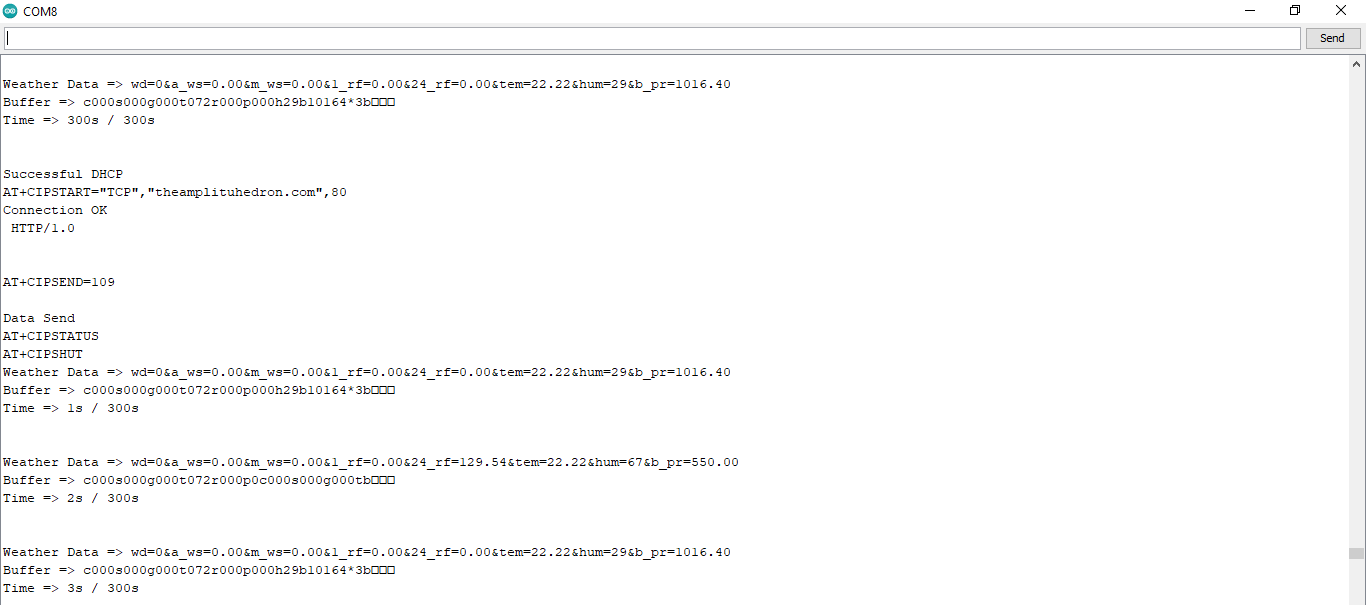
⭐コードをSIM808シールドにアップロードした後、シリアルモニターに毎秒気象データを表示し、5分(300秒)ごとにデータパケットをPHPWebアプリケーションに送信します。
<図>
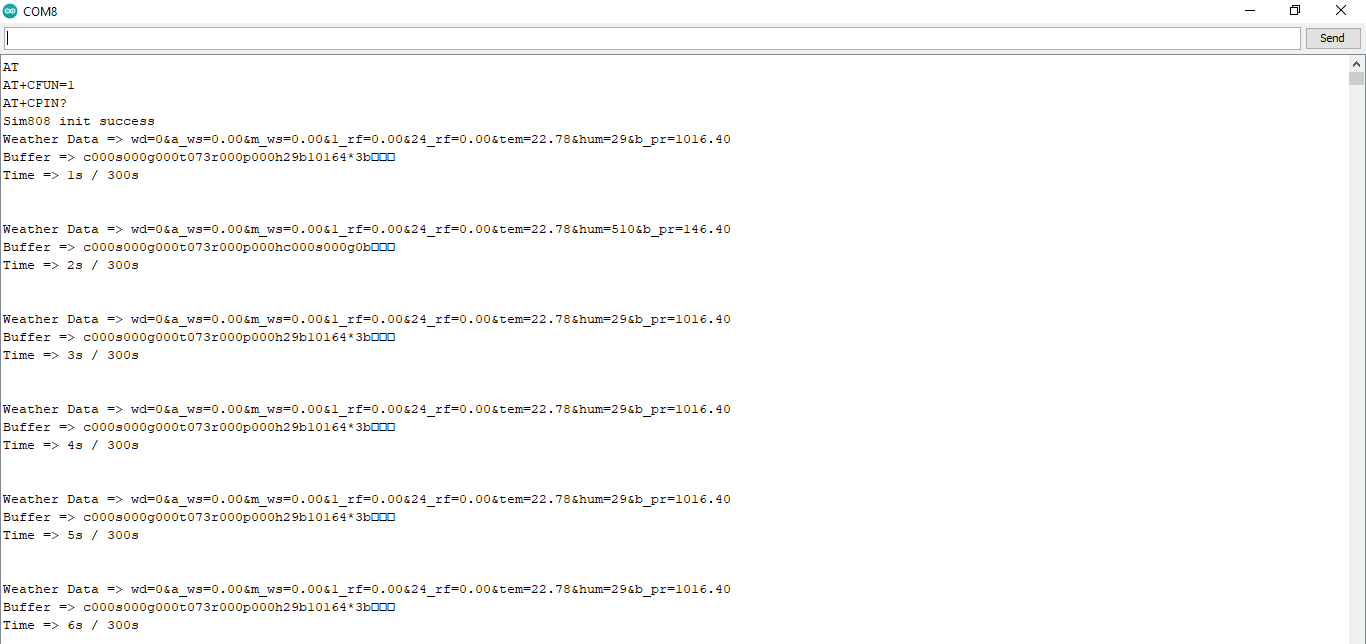
<図>
ステップ4.2:3か月以上の気象データセットを作成する
コーディングを終えた後、3か月以上にわたって5分ごとにGoogleスプレッドシートの気象データを照合して、ニューラルネットワークモデルを構築し、降雨強度を予測し始めました。
収集された気象データ:
- 風向(度)
- 平均風速(m / s)
- 最大風速(m / s)
- 1時間の降雨量(mm)
- 24時間の降雨量(mm)
- 温度(°C)
- 湿度(%)
- 気圧(hPa)
次に、スプレッドシートを Remote Weather Station.csv としてダウンロードしました。 、予備のローカル気象データセットとしての32219行で構成されています。データセットとモデルを改善するために、まだ気象データを照合しています:)
<図>
<図>
ステップ5:TensorFlowを使用して人工ニューラルネットワーク(ANN)を構築する
予備的な地域の気象データセットの照合が完了すると、人工ニューラルネットワーク(ANN)モデルの作業を開始して、降雨強度を予測しました。
PythonでTensorFlowを使用してニューラルネットワークモデルを作成することにしました。そこで、まず、以下の手順に従って、気象データをよりよく理解しました。
- データの視覚化
- データスケーリング(正規化)
- データ前処理
- データ分割
これらの手順を適用した後、ニューラルネットワークモデルを使用して、各入力(行)のラベル(出力)として理論的に割り当てられたさまざまな降雨強度クラスを分類することにしました。考えられる時間に応じて、降水量に応じてクラスを作成しました。
次のカテゴリは、降水量(降雨量)によって降雨強度を分類するために使用されます。
- 小雨 —降水量が1時間あたり2.5mm未満の場合
- 中程度の雨 —降水量が1時間あたり2.5mmから7.6mmの場合
- 大雨 —降水量が1時間あたり7.6mmから50mmの場合
- 激しい雨 —降水量が1時間あたり50mmを超える場合
降水量(降雨量)率に応じて、気象データを前処理して、各入力にこれら5つのクラスのいずれかをラベルとして割り当てました。
- 0(なし)
- 1(小雨)
- 2(中程度の雨)
- 3(大雨)
- 4(激しい雨)
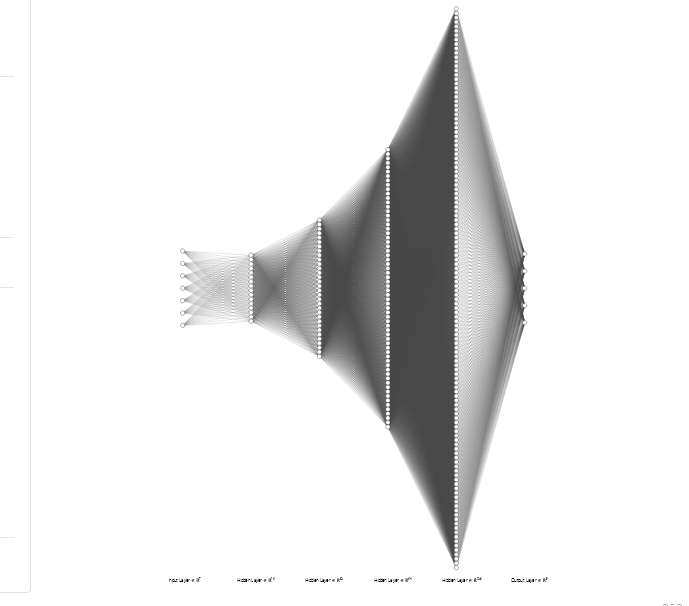
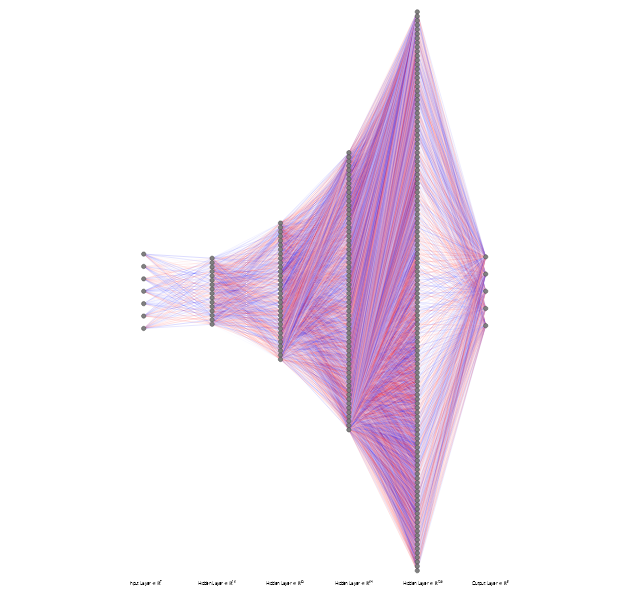
気象データをスケーリング(正規化)して前処理した後、前述の5つのクラスに分類された、読み取りごとに7つの入力変数と1つのラベルを引き出しました。次に、TensorFlowを使用して人工ニューラルネットワークモデルを構築し、予備データセットを使用して可能な限り最良の結果と予測を取得しました。
レイヤー:
- 7 [入力]
- 16 [非表示]
- 32 [非表示]
- 64 [非表示]
- 128 [非表示]
- 5 [出力]
<図>
<図>
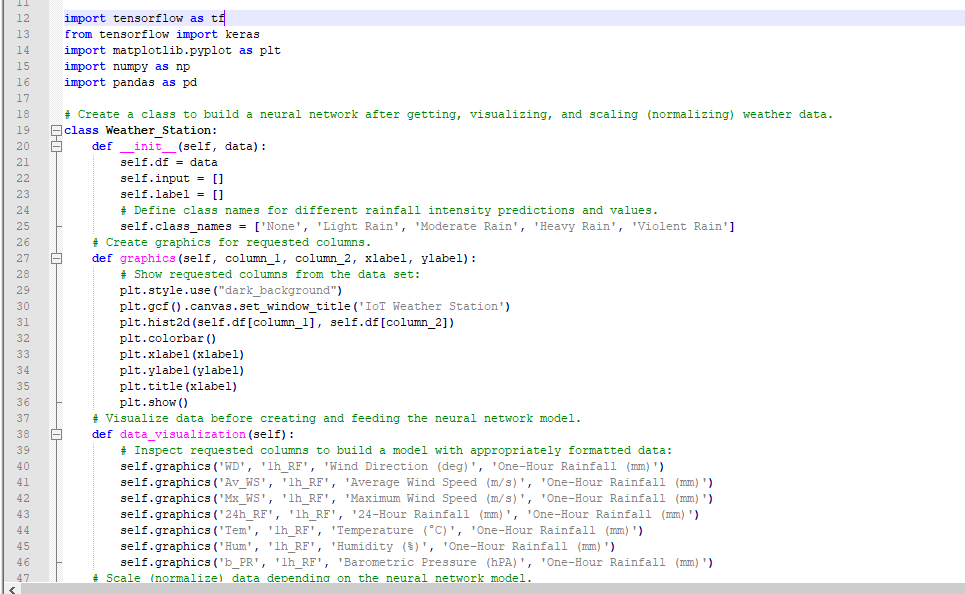
上記のすべての手順を実行するために、 Weather_Station という名前のクラスを作成しました。 必要なライブラリを含めた後のPythonの場合:
  import tensorflow as tf
 from tensorflow import keras
 import matplotlib.pyplot as plt
 import numpy as np
 import pandas as pd
続いて、上記の各ステップのPythonでのコーディングについて説明します。
また、 IoT_weather_station_neural_network.py をダウンロードすることもできます コーディングを検査します。
<図>
<図>
ステップ5.1:気象データの視覚化とスケーリング(正規化)
モデルを構築するために飛び込む前に、気象データを理解して、モデルに適切にフォーマットされたデータを渡すことが重要です。
したがって、このステップでは、Pythonで気象データを視覚化してスケーリング(正規化)する方法を示します。
⭐まず、 Remote Weather Station.csv から気象データを読み取ります 。
  csv_path ="E:\ PYTHON \ Remote Weather Station.csv"
 df =pd.read_csv(csv_path)
⭐ graphics()内 関数、Matplotlibライブラリを使用して、気象データセットから要求された列を視覚化します。
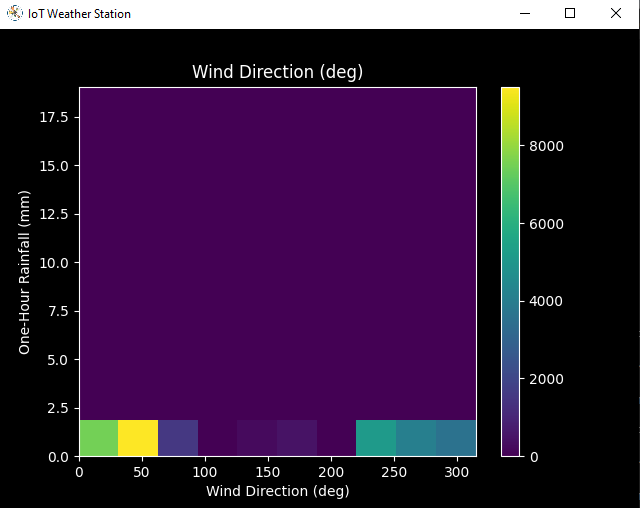
def graphics(self、column_1、column_2、xlabel、ylabel):
#データセットから要求された列を表示します:
plt.style.use( "dark_background")
plt.gcf()。canvas.set_window_title( 'IoT Weather Station')
plt.hist2d(self.df [column_1]、self.df [column_2])
plt.colorbar()
plt.xlabel(xlabel)
plt.ylabel(ylabel)
plt.title(xlabel)
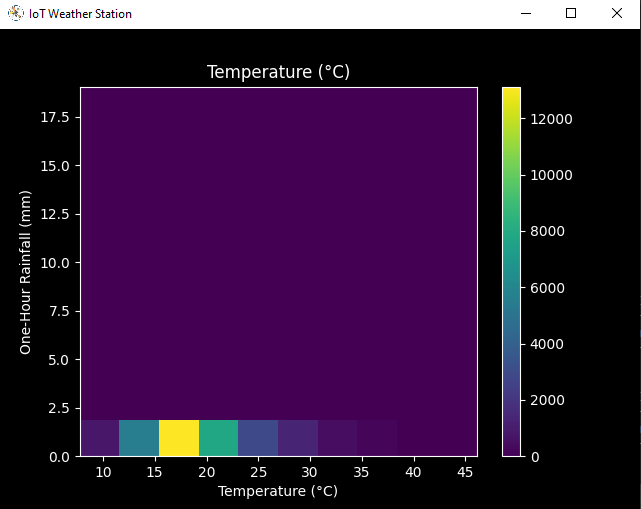
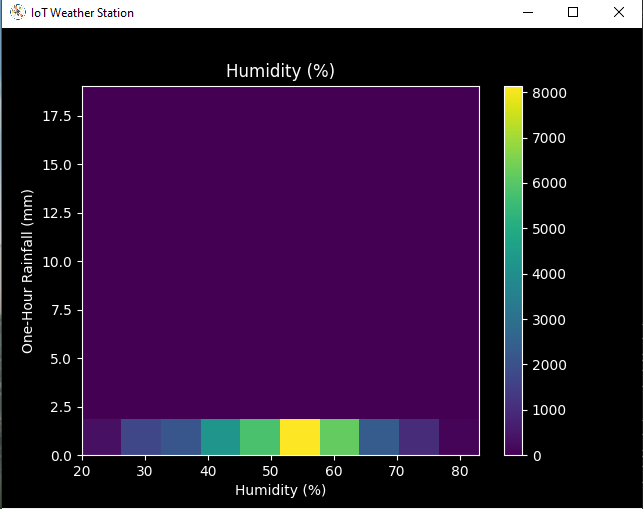
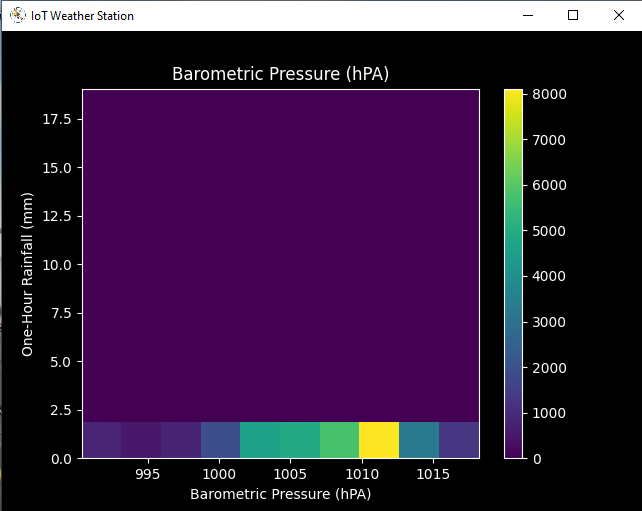
plt.show() ⭐ data_visualization() 関数、気象データをスケーリングする前にすべての列を検査して、適切にフォーマットされたデータでモデルを構築します。
  def data_visualization(self):
#適切にフォーマットされたデータでモデルを構築するために要求された列を検査します:
 self.graphics( 'WD'、 '1h_RF'、 '風向(deg ) '、' 1時間の降雨量(mm) ')
 self.graphics(' Av_WS '、' 1h_RF '、'平均風速(m / s) '、' 1時間の降雨量(mm) ')
 self.graphics( 'Mx_WS'、 '1h_RF'、 '最大風速(m / s)'、 '1時間の降雨量(mm)')
 self.graphics( '24h_RF'、 ' 1h_RF '、' 24時間降雨量(mm) '、' 1時間降雨量(mm) ')
 self.graphics(' Tem '、' 1h_RF '、' Temperature(°C) '、' One-時間降雨量(mm) ')
 self.graphics(' Hum '、' 1h_RF '、'湿度(%) '、' 1時間降雨量(mm) ')
 self.graphics(' b_PR '、' 1h_RF '、'気圧(hPA) '、' 1時間の降雨量(mm) ')
<図>
<図>
<図>
<図>
気象データを視覚化した後、各列を適切にフォーマットするためにスケーリング(正規化)しました。
通常、スケーリング前の各行(読み取り値)は次のようになりました:
- 315、0.45、0、0.51、0.51、22.78、65、1005.5
⭐ scale_data()内 機能:
⭐度と角度の単位での風向は、適切なモデル入力を行いません。 360°と0°は互いに近く、スムーズに巻き付く必要があります。風が吹いていない場合は、方向は関係ありません。したがって、風向と風速の列を風のベクトルに変換して、ニューラルネットワークモデルで簡単に解釈します。
  def scale_data(self):
#風の方向と速度:
 wv =self.df.pop( 'Av_WS')
 max_wv =self.df.pop( 'Mx_WS')
#ラジアンに変換します。
 wd_rad =self.df.pop( 'WD')* np.pi / 180
#風のx成分とy成分を計算します。
 self.df ['scaled_WX'] =wv * np.cos(wd_rad)
 self.df ['scaled_WY'] =wv * np.sin(wd_rad)
#最大風速を計算するxおよびyコンポーネント。
 self.df ['scaled_max_WX'] =max_wv * np.cos(wd_rad)
 self.df ['scaled_max_WY'] =max_wv * np.sin(wd_rad)

 ...
⭐ 1h_RF を除く残りの列 、それらを平均読み取り値に分割して、スケーリング(正規化)およびフォーマットします。
  ...

#温度:
 tem =self.df.pop( 'Tem')
 self.df ['scaled_Tem'] =tem / 25
#湿度:
 hum =self.df.pop( 'Hum')
 self.df ['scaled_Hum'] =hum / 70
#気圧:
 bPR =self.df.pop( 'b_PR')
 self.df ["scaled_bPR"] =bPR / 1013
#24時間の降雨量(概算)
 rain_24 =self .df.pop( '24h_RF')
 self.df ['scaled_24h_RF'] =rain_24 / 24
スケーリング(正規化)が完了した後、気象データセットから次の新しい列を抽出しました:
- scaled_WX
- scaled_WY
- scaled_max_WX
- scaled_max_WY
- scaled_Tem
- scaled_Hum
- scaled_bPR
- scaled_24h_RF
ステップ5.2:降雨強度クラスに関するモデル(ANN)のトレーニング
TensorFlowでニューラルネットワークモデルを構築してトレーニングする前に、スケーリングおよび正規化された気象データセットを前処理して、入力配列とラベル配列を作成する必要がありました。
⭐ create_input_and_label() 機能:
⭐まず、各入力要素をNumPy配列として入力配列に追加し、 asarray()を使用してNumPy配列に変換します。 機能。
⭐各入力要素には7つの変数が含まれています[shape =(7、)]:
- [scaled_WX、scaled_WY、scaled_max_WX、scaled_max_WY、scaled_Tem、scaled_Hum、scaled_bPR]
  def create_input_and_label(self):
 n =len(self.df)
#スケーリングされた変数を使用して入力配列を作成します。
 for i in range(n):
 self.input.append(np.array([self.df ['scaled_WX'] [i]、self.df ['scaled_WY'] [i]、self.df ['scaled_max_WX'] [i] 、self.df ['scaled_max_WY'] [i]、self.df ['scaled_Tem'] [i]、self.df ['scaled_Hum'] [i]、self.df ['scaled_bPR'] [i]]) )
 self.input =np.asarray(self.input)

 ...
⭐次に、各測定値(行)のおおよその降雨量(降水量)を評価します。
approx_RF_rate =(1h_RF + scaled_24h_RF)* 100
⭐降雨量に応じて、入力要素ごとにクラス[0-4]を割り当て、ラベル配列に追加します。
...
for i in range(n):
_class =0
#おおよその降雨量を評価します:
approx_RF_rate =( self.df ['1h_RF'] [i] + self.df ['scaled_24h_RF'] [i])* 100
#ラベルとして、おおよその降雨量(mm)に従って降雨強度のクラスを割り当てます。
ifapprox_RF_rate ==0:
_class =0
elifapprox_RF_rate <2.5:
_class =1
elif 2.5
elif 7.6
else:
_class =4
self.label.append(_class)
self.label =np.asarray(self.label) スケーリングされた気象データを前処理して入力配列とラベル配列を作成した後、それらをトレーニング(60%)およびテスト(40%)データセットとして分割しました。
def split_data(self):
n =len(self.df)
#(60%、40%)-(トレーニング、テスト)
self.train_input =self.input [0:int(n * 0.6)]
self.test_input =self.input [int(n * 0.6):]
self.train_label =self.label [0:int(n * 0.6)]
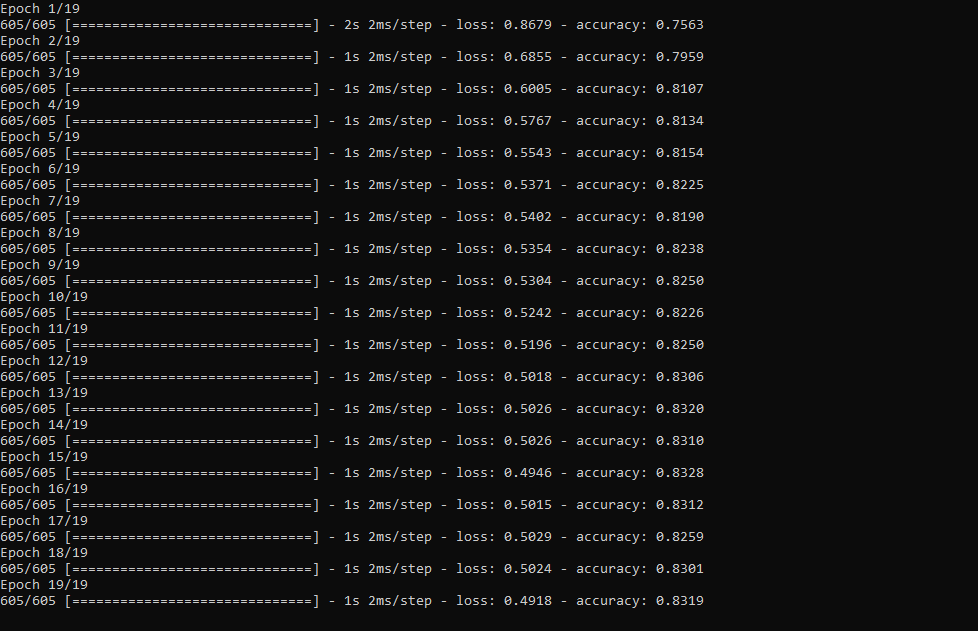
self.test_label =self.label [int(n * 0.6):] 次に、Kerasを使用して人工ニューラルネットワーク(ANN)モデルを構築し、19エポックのトレーニングデータセットを使用してトレーニングしました。
これらのチュートリアルを調べて、活性化関数、損失関数、エポックなどについて学ぶことができます。
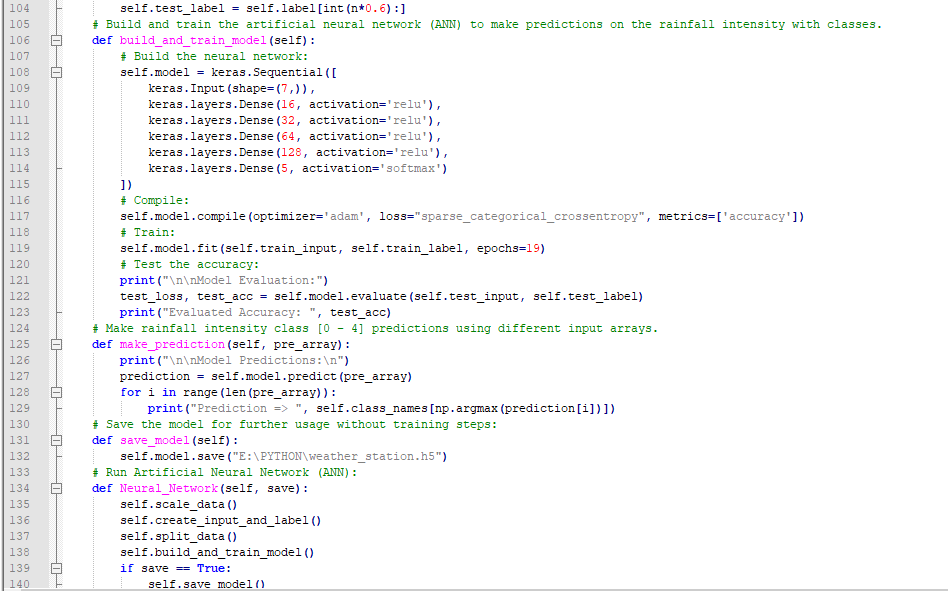
  def build_and_train_model(self):
#ニューラルネットワークを構築します:
 self.model =keras.Sequential([
 keras.Input(shape =(7、)) 、
 keras.layers.Dense(16、activation ='relu')、
 keras.layers.Dense(32、activation ='relu')、
 keras.layers.Dense(64 、activation ='relu')、
 keras.layers.Dense(128、activation ='relu')、
 keras.layers.Dense(5、activation ='softmax')
] )
#コンパイル:
 self.model.compile(optimizer ='adam'、loss ="sparse_categorical_crossentropy"、metrics =['accuracy'])
#トレーニング:
 self .model.fit(self.train_input、self.train_label、epochs =19)

 ...
予備トレーニングデータセットを使用してトレーニングした後、モデルの精度は 0.83〜0.85 です。 。
<図>
ステップ5.3:モデルを評価し、降雨強度を予測する
人工ニューラルネットワークモデルを構築してトレーニングした後、予備テストデータセットを使用してその精度をテストしました。
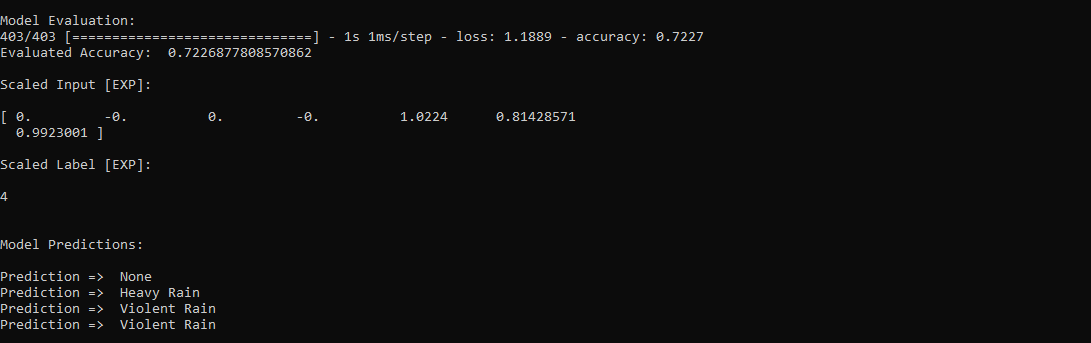
今のところ、モデルの評価された精度は 0.72〜0.73 です。 モデルを過剰適合させる不十分なテストデータセットが原因です。ただし、モデルの精度を向上させるために、まだ気象データを収集しています。
  ...

#精度をテストします:
 print( "\ n \ nモデル評価:")
 test_loss、test_acc =self.model.evaluate (self.test_input、self.test_label)
 print( "Evaluated Accuracy:"、test_acc)
次に、ニューラルネットワークモデルを使用して、モデルのトレーニング後の気象観測所からの読み取り値で構成される特定の予測配列を使用して、降雨強度を予測しました。出発点として、モデルは正常に機能します:)
モデルは、各入力要素のラベルの可能性を5つの数値の配列として予測します。これらは、指定された入力要素が5つの異なるクラスの降雨強度[0-4]のそれぞれに対応するというモデルの「信頼度」を表します。
⭐ make_prediction() 関数、指定された配列の各入力要素の予測を行い、 argmax()を使用して最も正確なラベル[0-4]を取得します クラス名を表示する関数。
  def make_prediction(self、pre_array):
 print( "\ n \ nModel Predictions:\ n")
 Forecast =self.model.predict(pre_array)
 for i in range(len(pre_array)):
 print( "Prediction =>"、self.class_names [np.argmax(prediction [i])])
予測入力:
- [0、0、0.31819805、0.31819805、0.6988、0.81498571、0.99349753]
- [0、-0、0、-0、0.8444、1、0.96835143]
- [0、0、0.45、0、0.87577、0.95857143、1.00128332]
- [-0、-0、-0、-0、0.8224、1.05714286、0.99279368]
予測出力:
- 0 [なし]
- 3 [大雨]
- 4 [激しい雨]
- 4 [激しい雨]
<図>

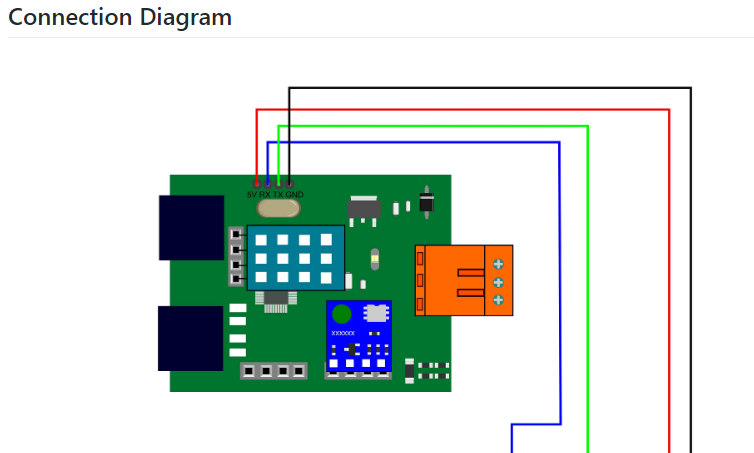
接続と調整(ESP8266)
//接続
// NodeMCU ESP-12E(ESP8266):
// Weather Station
// VV ------------ --------------- 5V
// D5 --------------------------- RX
// D6 --------------------------- TX
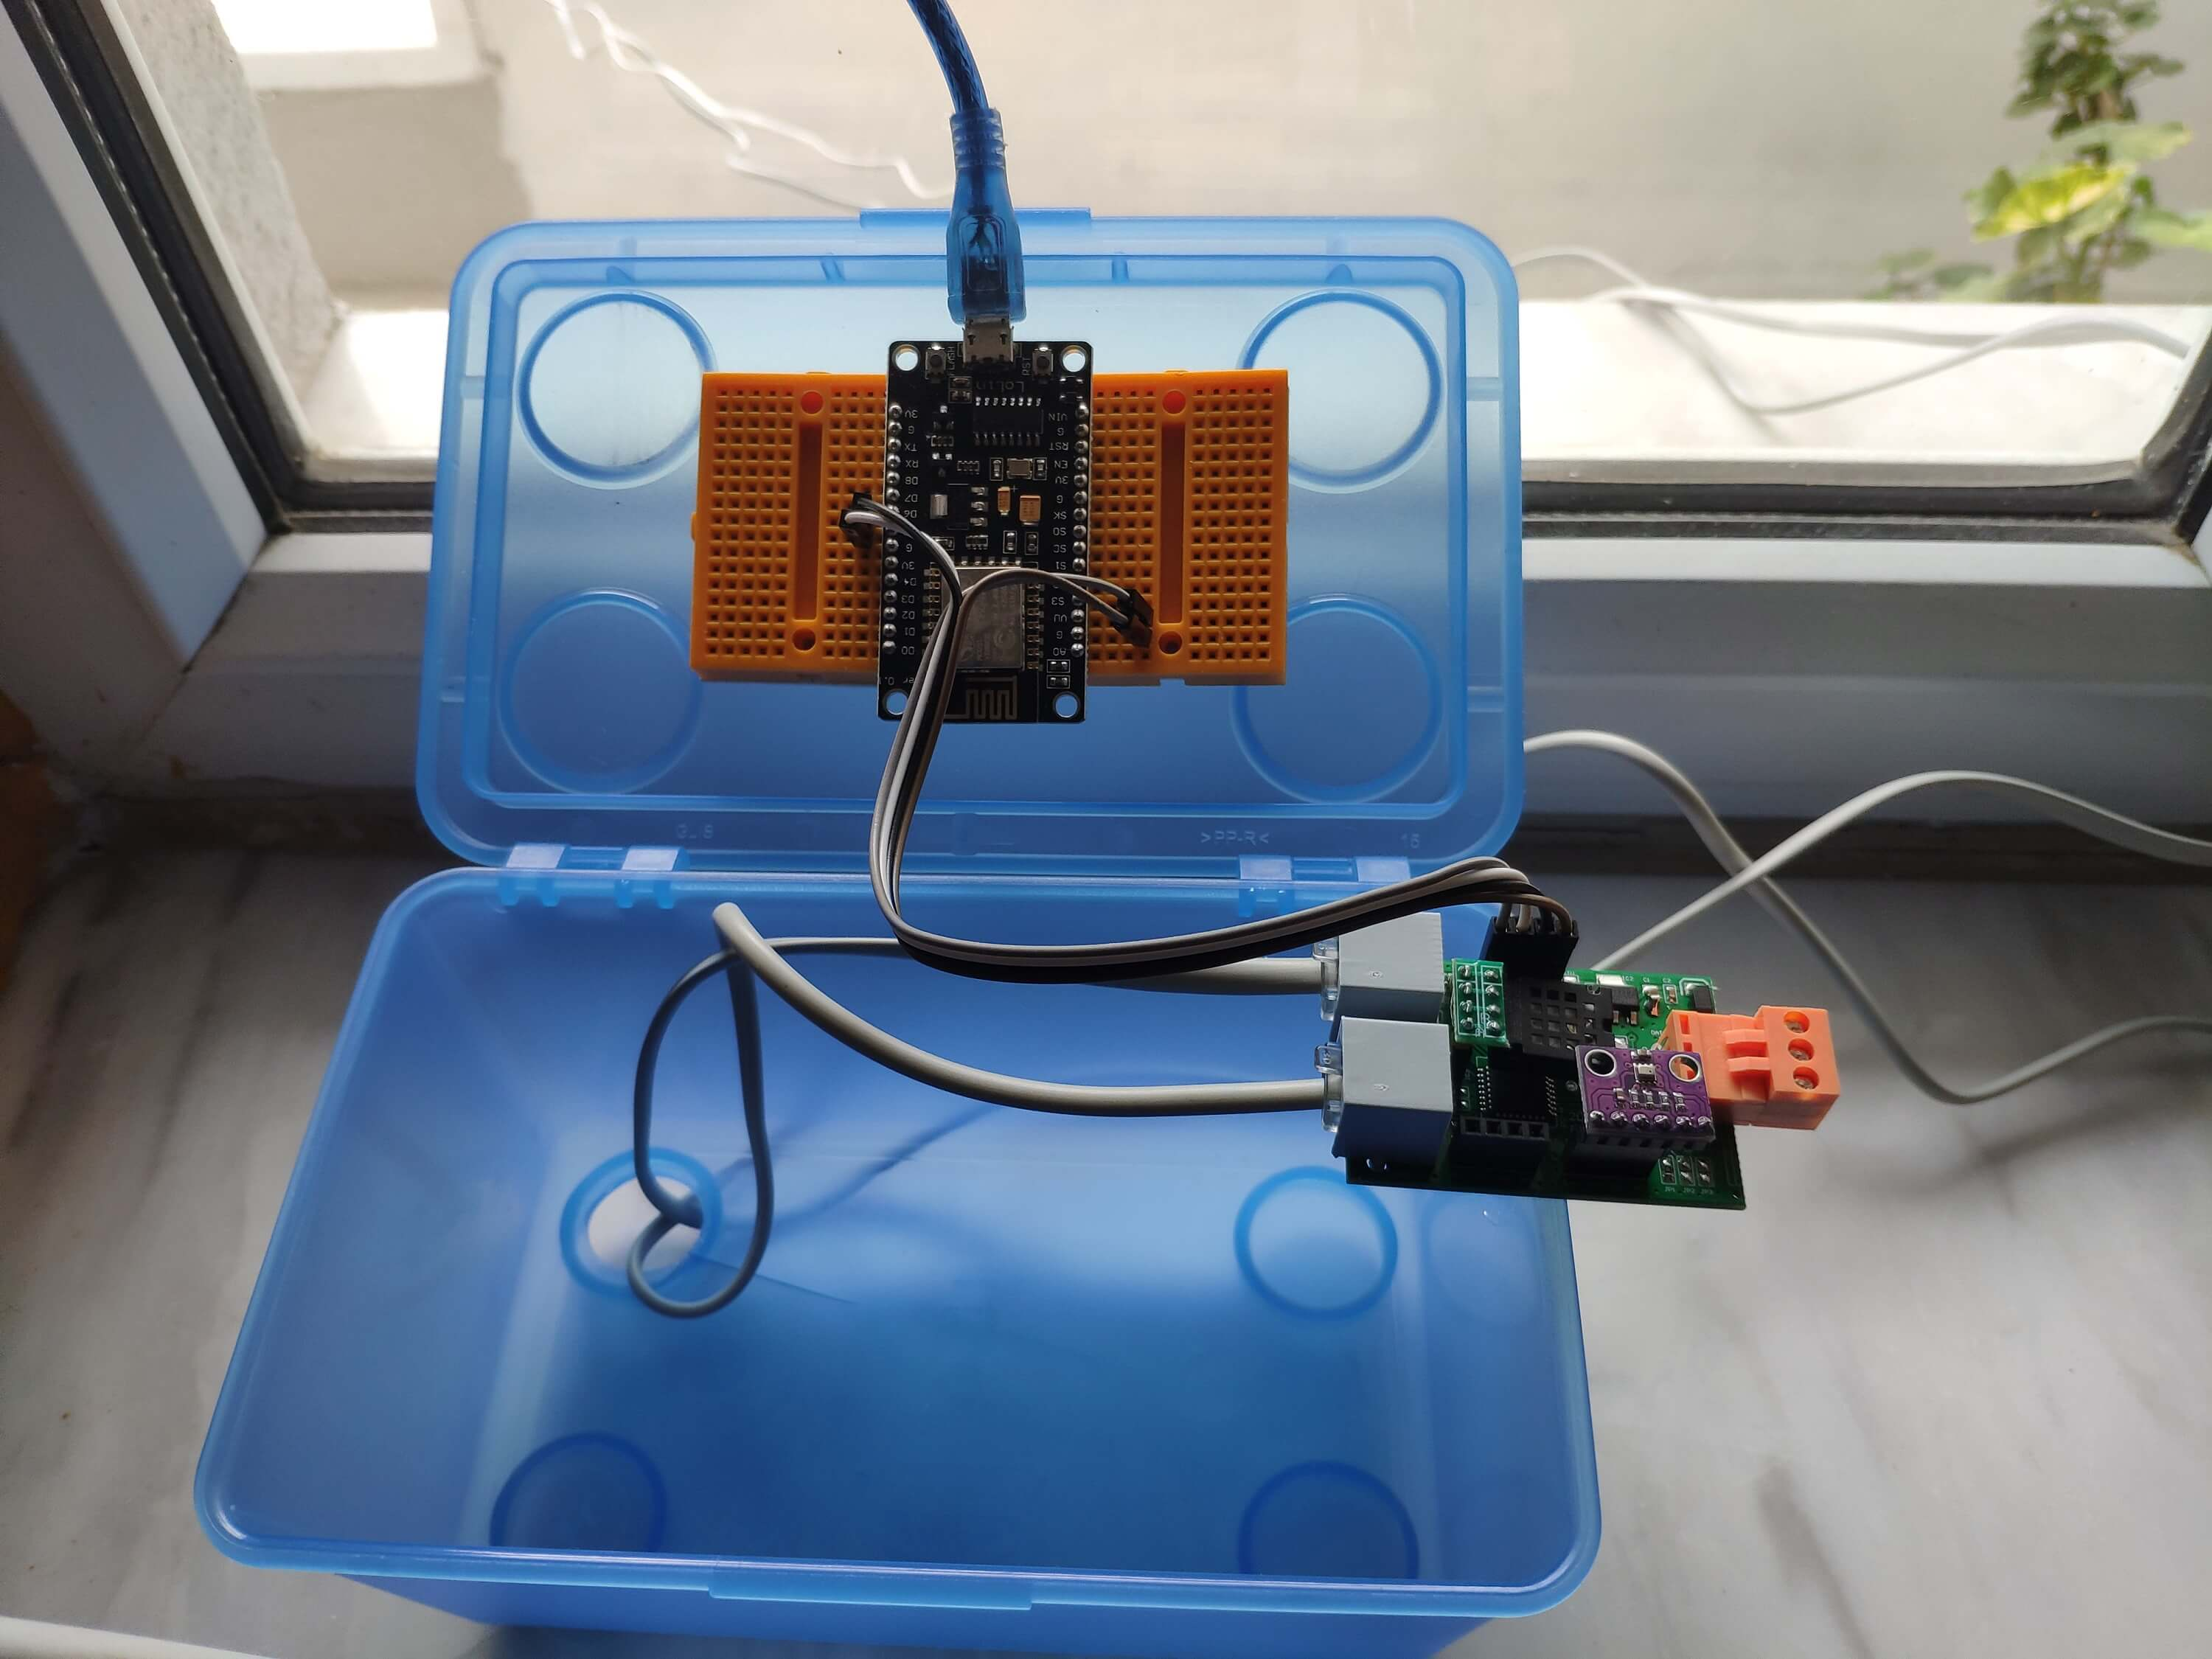
// G ------- -------------------- GND センサー(コンバーター)ボードをNodeMCU ESP-12E(ESP8266)開発ボードに接続し、バルコニーで気象データを収集しながら、プラスチックの箱に固定しました。
<図>
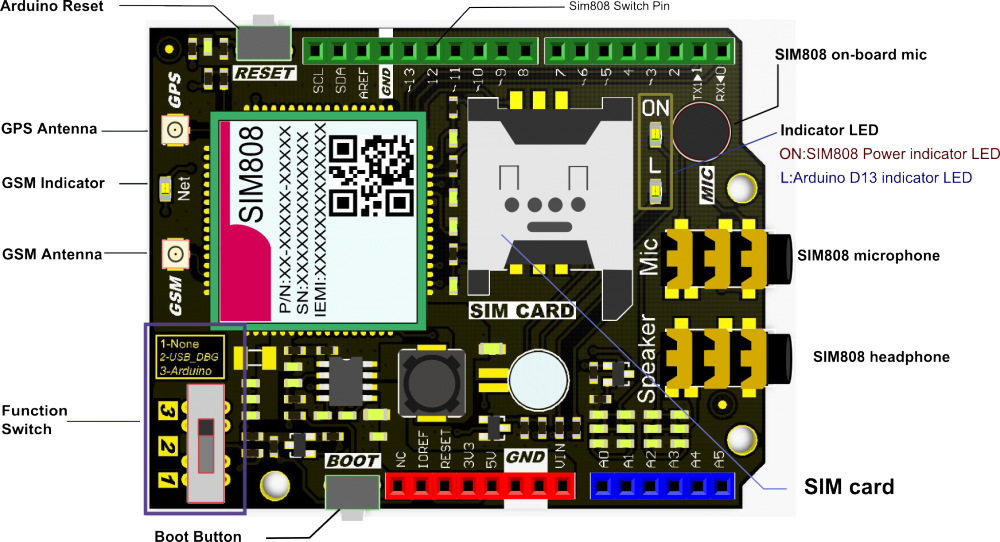
接続と調整(SIM808)
  //接続
 // Arduino Uno:
 // Arduino用SIM808GPS / GPRS / GSMシールド
 // D0 ---------- ----------------- RX
 // D1 ------------------------- --TX
 // D12 --------------------------- POWER
 // Weather Station
 // 5V --------------------------- 5V
 // D5 ------------ --------------- RX
 // D6 --------------------------- TX
 // GND --------------------------- GND
⭐注:D0、D1、D12ピンはSIM808 GPS / GPRS / GSMシールドによって占有されています。
⭐SIM808モジュールが正しく動作するように外部バッテリー(7-23V)を接続します。
⭐GPSアンテナとGSMアンテナをSIM808シールドに取り付けます。
⭐SIMカードをSIM808シールドのSIMスロットに挿入します。
⭐コードをアップロードする前に、シールドの機能スイッチをなしに設定します (1)。
⭐コードをアップロードします。
⭐次に、機能スイッチを Arduino に設定します (3)。
⭐ネットインジケーターLEDが1秒ごとに点滅するまでシールドのブートボタンを押し、SIMカードがネットワークを登録するのを待ちます-ネットインジケーターLEDは3秒ごとにゆっくり点滅します。
⭐SIM808GSM/ GPS / GPRSシールドの詳細については、ここをクリックしてください。
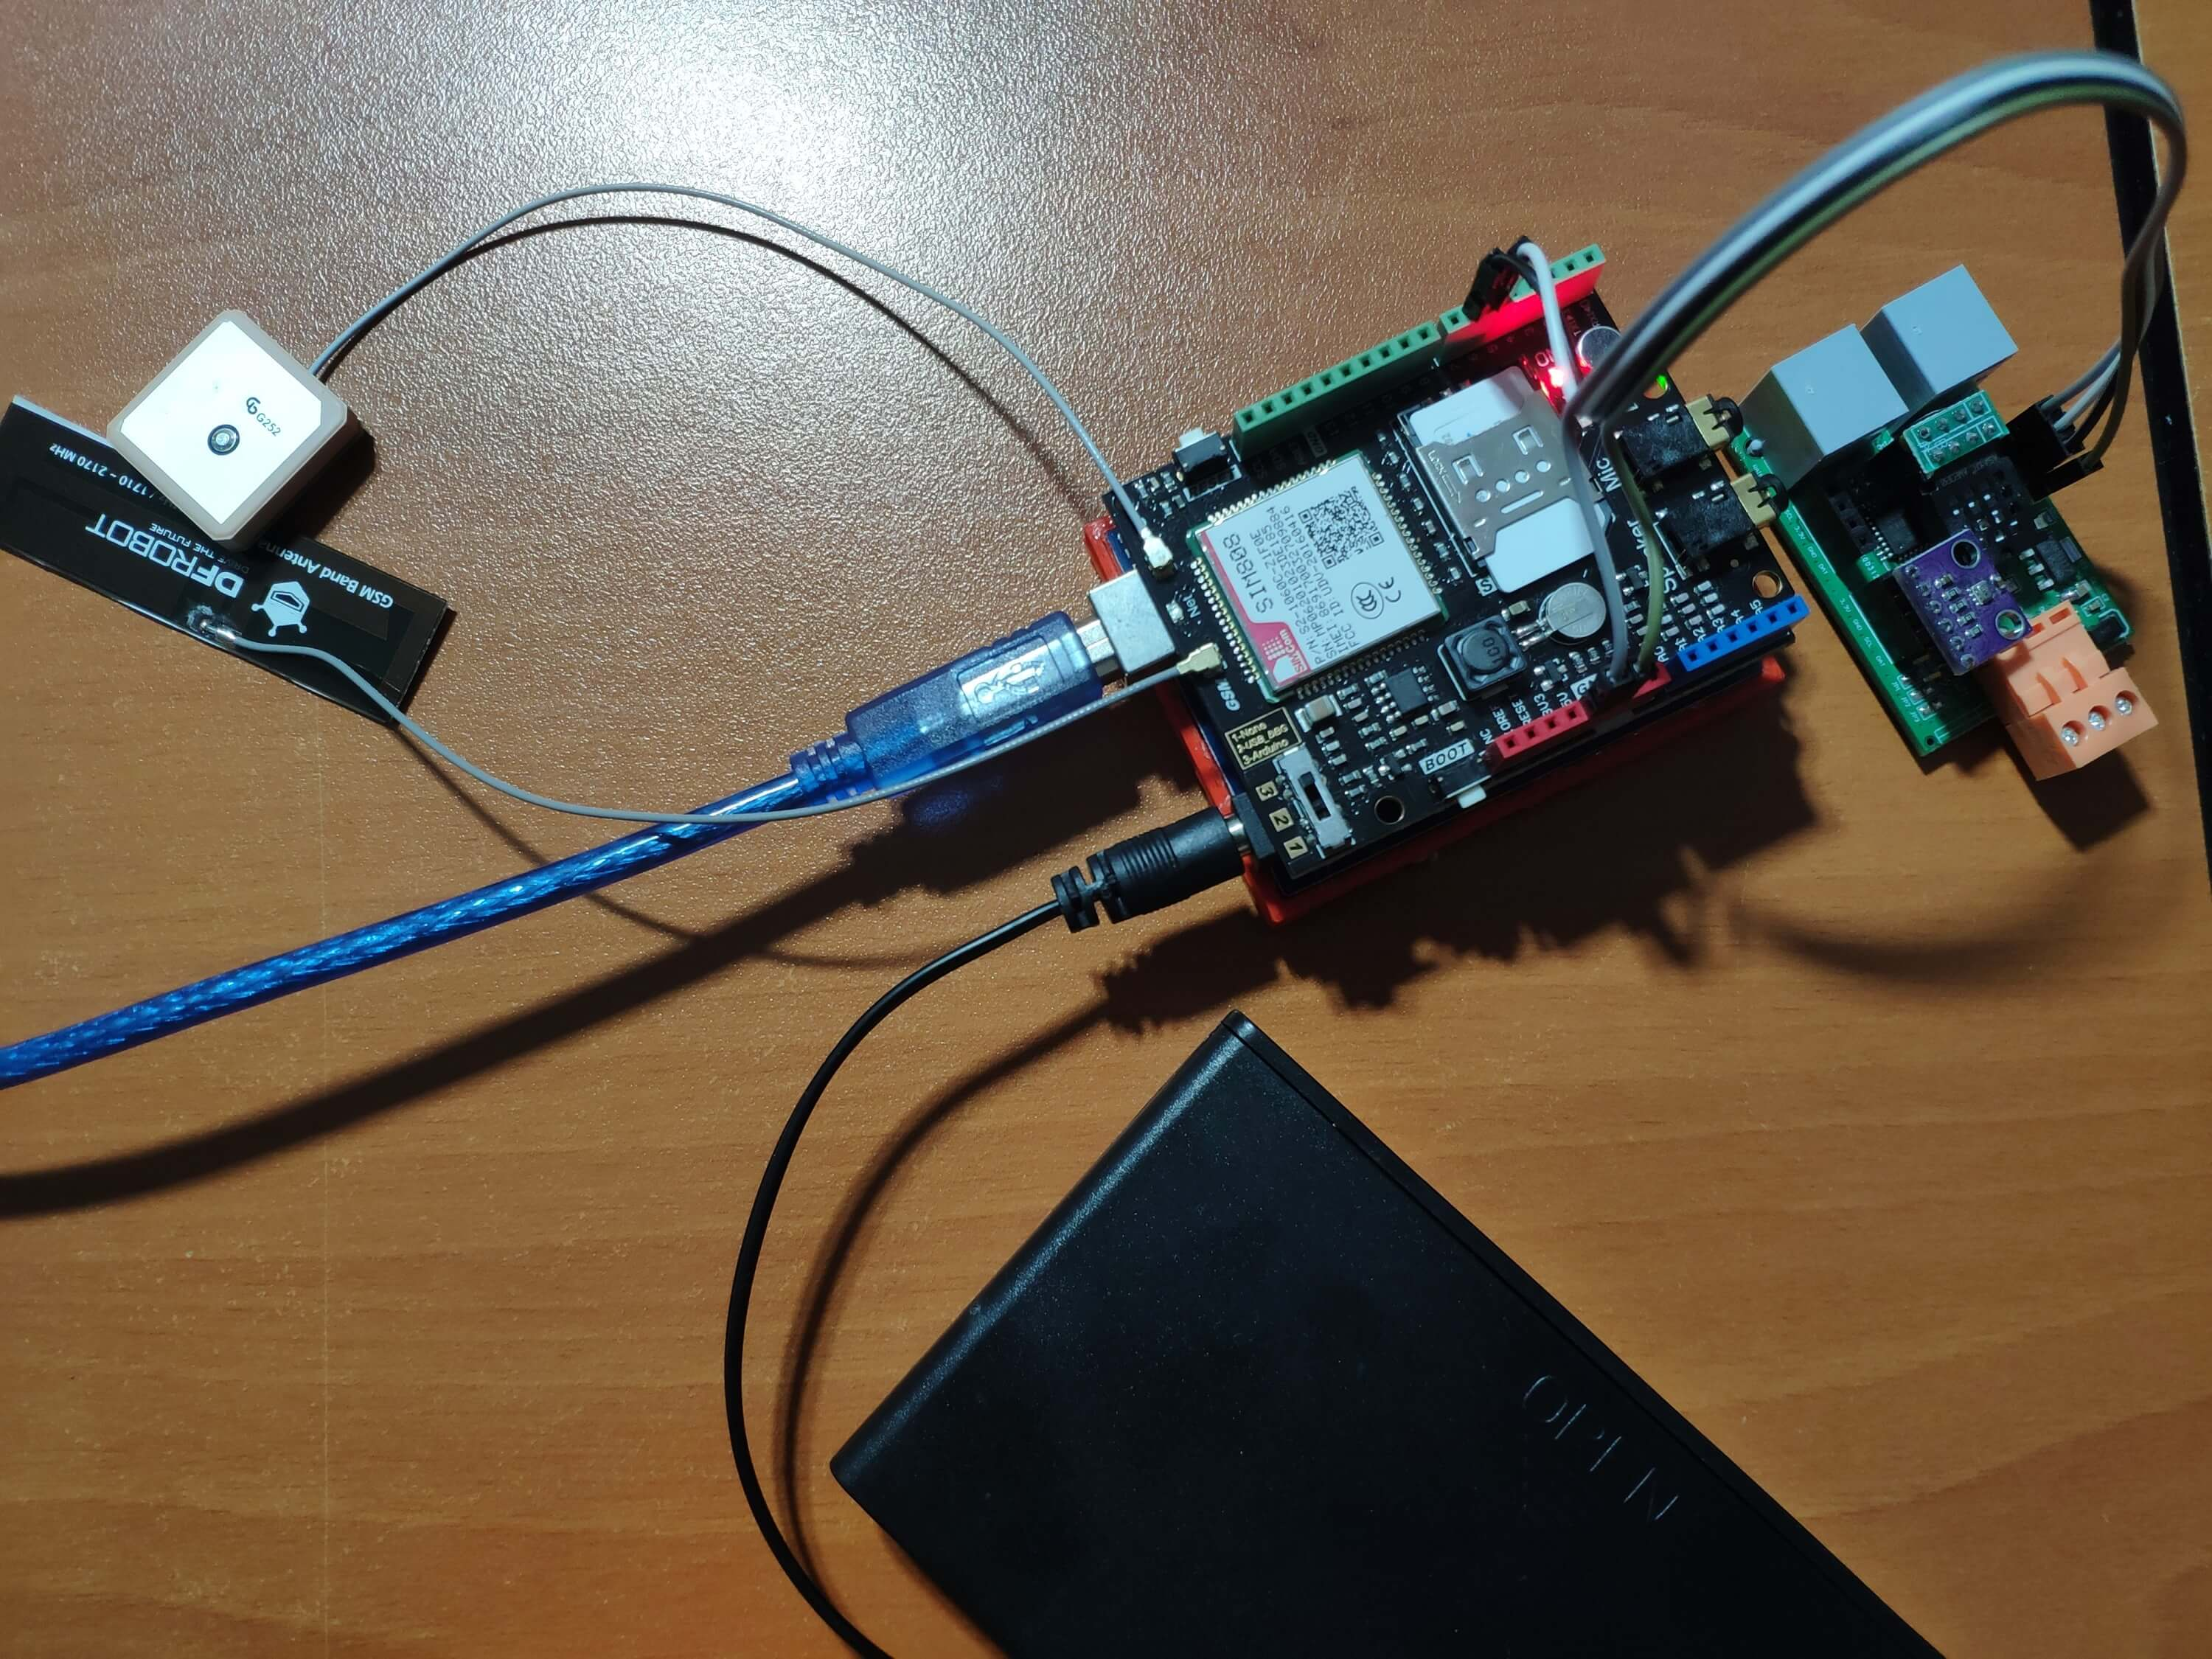
Arduino UnoでSIM808シールドをセットアップした後、センサー(コンバーター)ボードを接続しました。
<図>
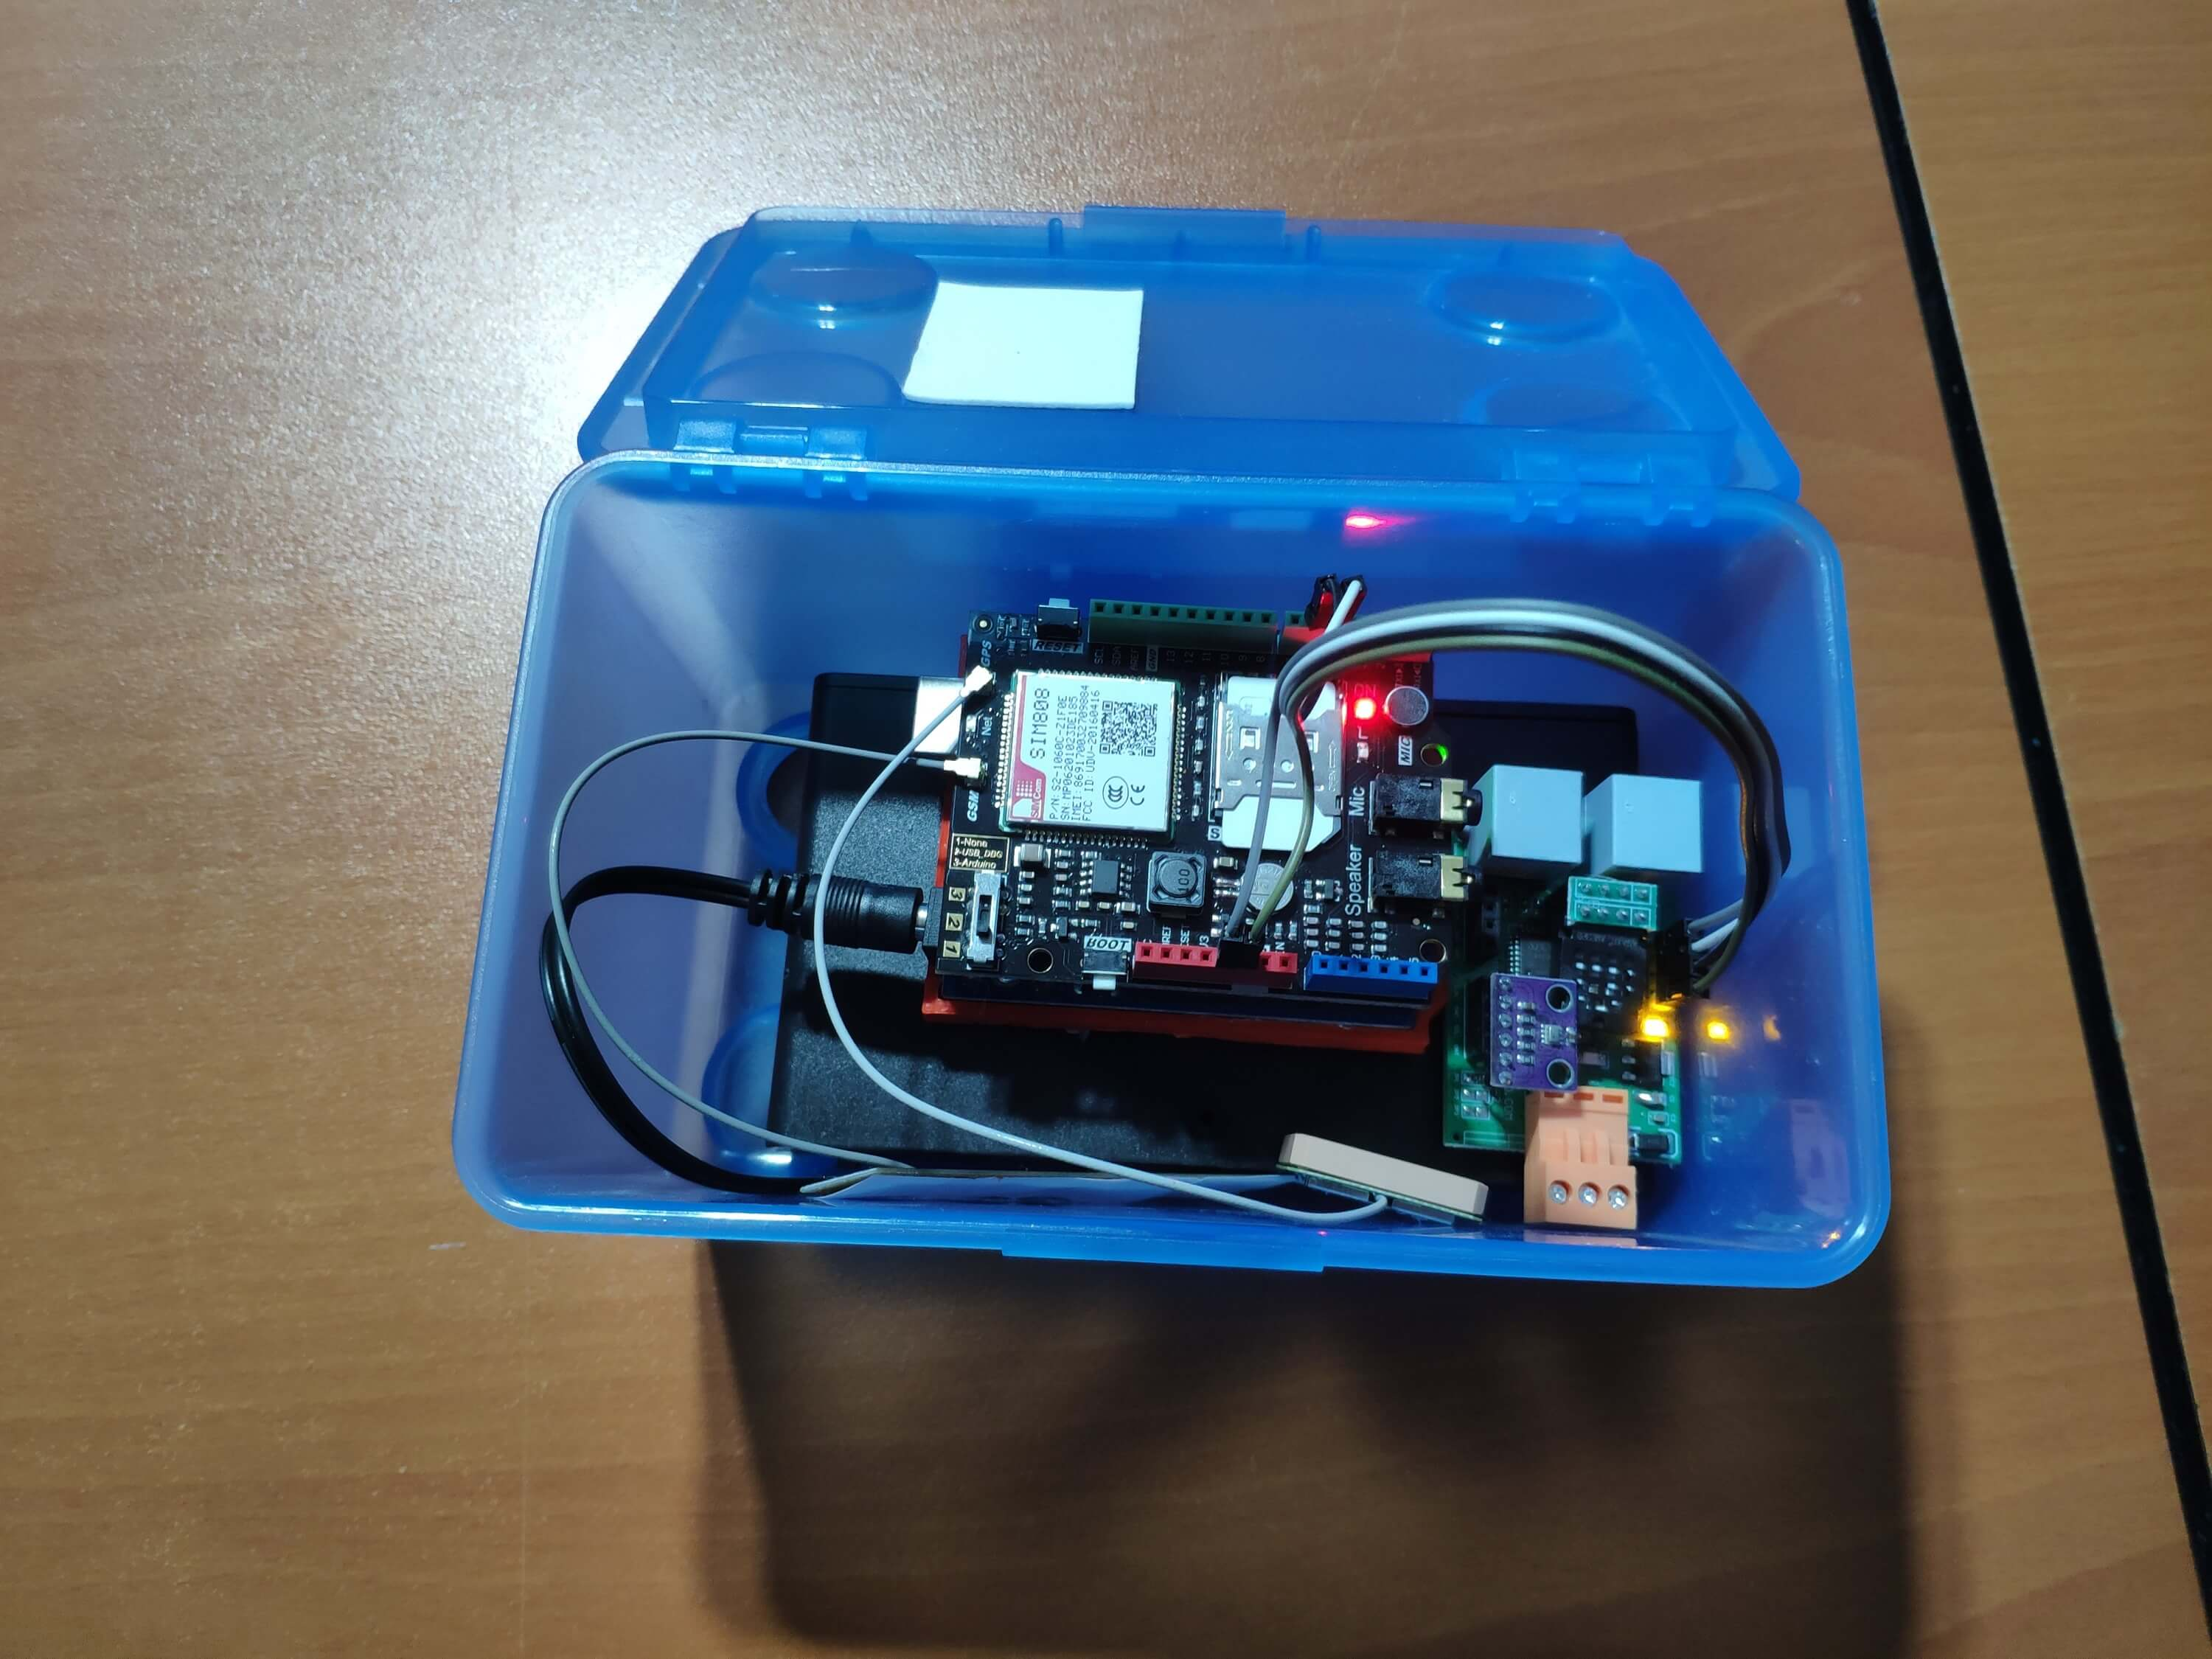
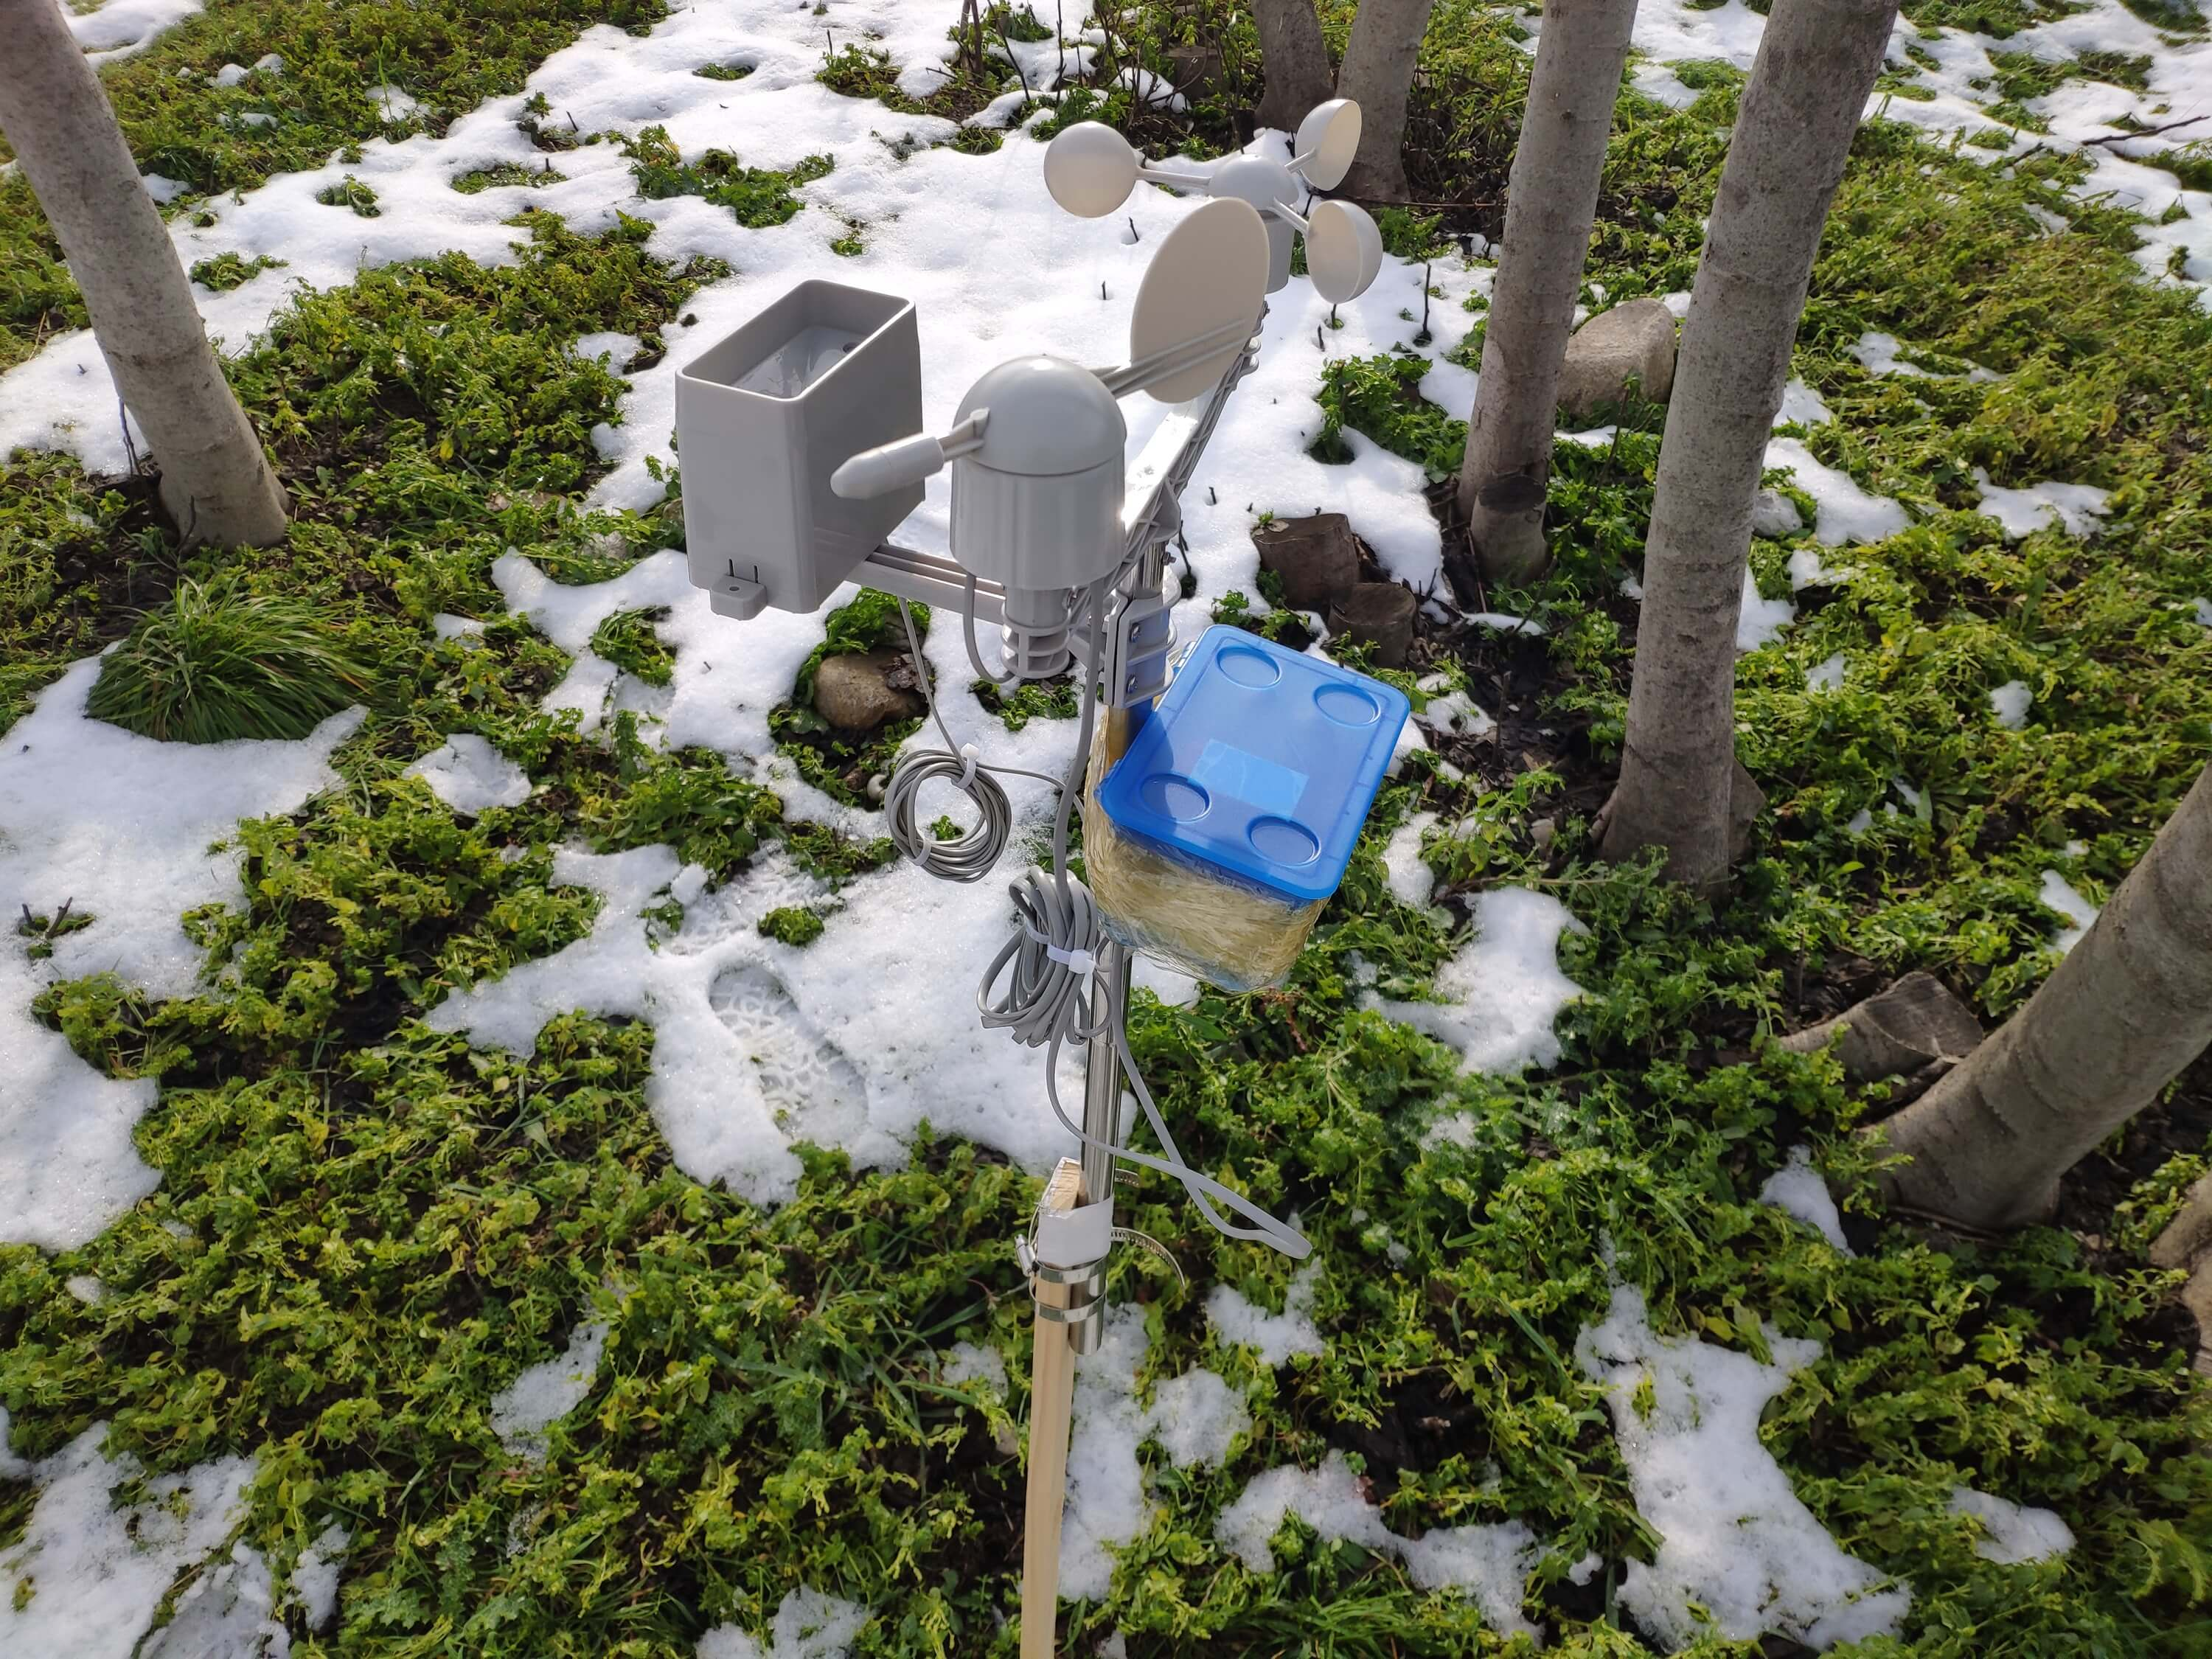
センサーボードは耐候性がないため、極端な気象条件でも屋外の気象データを収集するために、すべてのコンポーネントをプラスチックの箱に入れました。
<図>
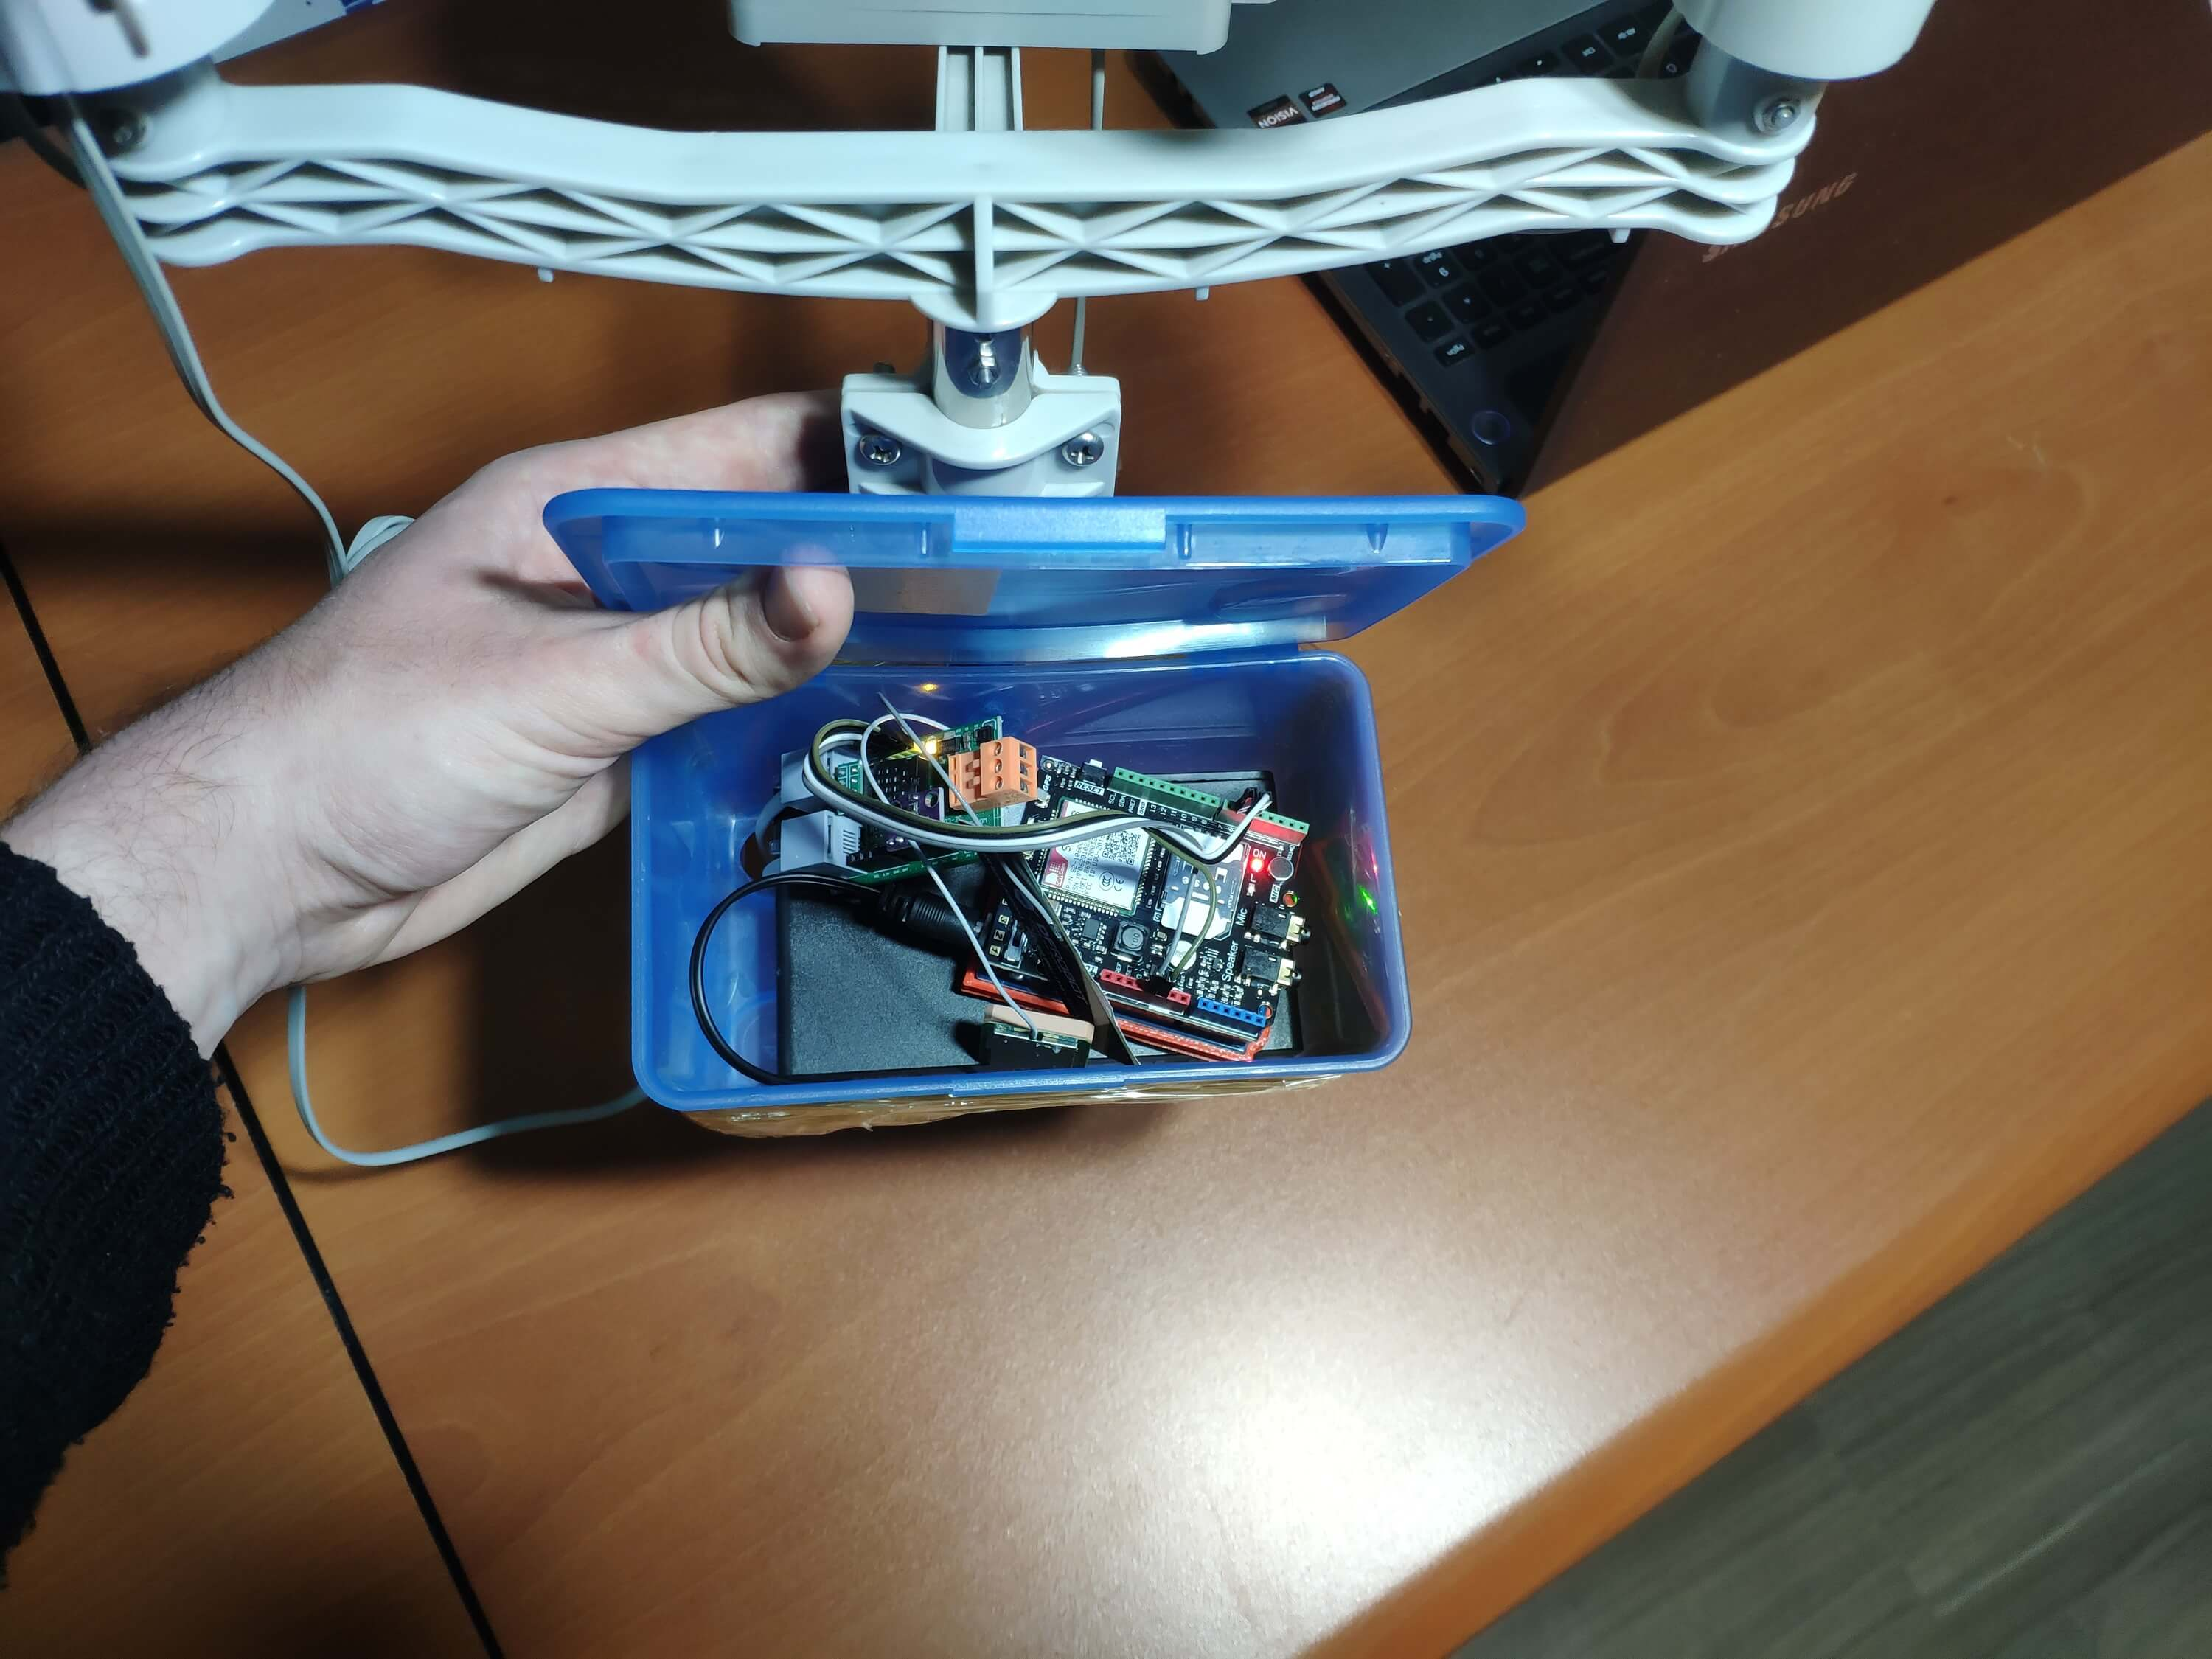
次に、プラスチックの箱を気象観測所に固定しました。
<図>
ビデオと結論
気象ステーションのコーディングと組み立てが完了した後、5分ごとに3か月以上にわたって地域の気象データを照合して、ニューラルネットワークモデルを正常に構築しました。
ニューラルネットワークモデルとその精度を向上させるために、バルコニーと裏庭で気象データを収集しています:)
<図>
<図>
<図>
さらなる議論
☔💧気象現象をより正確に予測するには、地域の気象データセットが必要なので、このような予算にやさしいNN対応の気象観測所を農場や温室に配置して、過度の降雨による農業への悪影響を回避できます。
☔💧ニューラルネットワークと連携する早期警報システムとして、それらを同時に使用して、相互に通信および給電する気象観測所の群れを作成し、地域の降雨強度を正確に予測できます。
☔💧また、その情報を評価に利用できます:
- 重要な水資源
- 農業
- 作物の生産性
- エコシステム
- 水文学。
<図>
<図>
参考資料
[1] 悪天候-大雨 、NIWA、https://niwa.co.nz/natural-hazards/extreme-weather-heavy-rainfall
[2]イリノイ大学アーバナシャンペーン校、ニュースビューロー。 「極端な暑さ、干ばつなど、トウモロコシの収穫量に悪影響を与えるような過度の降雨。 "ScienceDaily。ScienceDaily、2019年4月30日。www.sciencedaily.com/ releases / 2019/04 /190430121744.htm。
[3] Andrew Culclasure、ニューラルネットワークを使用して地域の天気予報を提供する 、ジョージアサザン大学、2013年春、29https://digitalcommons.georgiasouthern.edu/cgi/viewcontent.cgi?article =1031&context =etd。
コード
- IoT_weather_station_neural_network.py
- ESP12E_remote_weather_station.ino
- SIM808_remote_weather_station.ino
- index.php(Webアプリケーション)
- account_verification_token.php(Webアプリケーション)
IoT_weather_station_neural_network.py Python
#TensorFlowを使用して降雨強度を予測するIoT Weather Station#Windows、Linux、またはUbuntu#Kutluhan Aktar#Googleスプレッドシートの気象データを照合し、TensorFlowに組み込まれたニューラルネットワークで解釈して降雨強度を予測します。 #詳細情報:#https://www.theamplituhedron.com/projects/IoT_Weather_Station_Predicting_Rainfall_Intensity_with_TensorFlowimport tensorflow as tffrom tensorflow import kerasimport matplotlib.pyplot as pltimport numpy as npimport pandas as pd#クラスを作成してニューラルネットワークを構築する気象データのスケーリング(正規化)。classWeather_Station:def __init __(self、data):self.df =data self.input =[] self.label =[]#さまざまな降雨強度の予測と値のクラス名を定義します。 self.class_names =['None'、 'Light Rain'、 'Moderate Rain'、 'Heavy Rain'、 'Violent Rain']#要求された列のグラフィックを作成します。 def graphics(self、column_1、column_2、xlabel、ylabel):#データセットから要求された列を表示します:plt.style.use( "dark_background")plt.gcf()。canvas.set_window_title( 'IoT Weather Station')plt .hist2d(self.df [column_1]、self.df [column_2])plt.colorbar()plt.xlabel(xlabel)plt.ylabel(ylabel)plt.title(xlabel)plt.show()#作成する前にデータを視覚化するニューラルネットワークモデルにフィードします。 def data_visualization(self):#要求された列を検査して、適切にフォーマットされたデータでモデルを構築します:self.graphics( 'WD'、 '1h_RF'、 'Wind Direction(deg)'、 'One-Hour Rainfall(mm)')self .graphics( 'Av_WS'、 '1h_RF'、 '平均風速(m / s)'、 '1時間の降雨量(mm)')self.graphics( 'Mx_WS'、 '1h_RF'、 '最大風速(m / s) '、' 1時間の降雨量(mm) ')self.graphics(' 24h_RF '、' 1h_RF '、' 24時間の降雨量(mm) '、' 1時間の降雨量(mm) ')self.graphics ( 'Tem'、 '1h_RF'、 'Temperature(C)'、 'One-Hour Rainfall(mm)')self.graphics( 'Hum'、 '1h_RF'、 'Humidity(%)'、 'One-Hour Rainfall (mm) ')self.graphics(' b_PR '、' 1h_RF '、'気圧(hPA) '、' 1時間の降雨量(mm) ')#ニューラルネットワークモデルに応じてデータをスケーリング(正規化)します。 def scale_data(self):#風向と風速:wv =self.df.pop( 'Av_WS')max_wv =self.df.pop( 'Mx_WS')#ラジアンに変換します。 wd_rad =self.df.pop( 'WD')* np.pi / 180#風のx成分とy成分を計算します。 self.df ['scaled_WX'] =wv * np.cos(wd_rad)self.df ['scaled_WY'] =wv * np.sin(wd_rad)#最大風のxおよびy成分を計算します。 self.df ['scaled_max_WX'] =max_wv * np.cos(wd_rad)self.df ['scaled_max_WY'] =max_wv * np.sin(wd_rad)#温度:tem =self.df.pop( 'Tem')self .df['scaled_Tem'] =tem / 25 # Humidity:hum =self.df.pop('Hum') self.df['scaled_Hum'] =hum / 70 # Barometric Pressure:bPR =self.df.pop( 'b_PR') self.df["scaled_bPR"] =bPR / 1013 # 24 Hour Rainfall (Approx.) rain_24 =self.df.pop('24h_RF') self.df['scaled_24h_RF'] =rain_24 / 24 # Define the input and label arrays. def create_input_and_label(self):n =len(self.df) # Create the input array using the scaled variables:for i in range(n):self.input.append(np.array([self.df['scaled_WX'][i], self.df['scaled_WY'][i], self.df['scaled_max_WX'][i], self.df['scaled_max_WY'][i], self.df['scaled_Tem'][i], self.df['scaled_Hum'][i], self.df['scaled_bPR'][i]])) self.input =np.asarray(self.input) # Create the label array using the one-hour and 24-hour rainfall variables:for i in range(n):_class =0 # Evaluate the approximate rainfall rate:approx_RF_rate =(self.df['1h_RF'][i] + self.df['scaled_24h_RF'][i]) * 100 # As labels, assign classes of rainfall intensity according to the approximate rainfall rate (mm):if approx_RF_rate ==0:_class =0 elif approx_RF_rate <2.5:_class =1 elif 2.5 ", self.class_names[np.argmax(prediction[i])]) # Save the model for further usage without training steps:def save_model(self):self.model.save("E:\PYTHON\weather_station.h5") # Run Artificial Neural Network (ANN):def Neural_Network(self, save):self.scale_data() self.create_input_and_label() self.split_data() self.build_and_train_model() if save ==True:self.save_model() # Example Input and Layer:print("\nScaled Input [EXP]:\n") print(self.train_input[0]) print("\nScaled Label [EXP]:\n") print(self.train_label[0]) # Read data (Remote Weather Station.csv):csv_path ="E:\PYTHON\Remote Weather Station.csv"df =pd.read_csv(csv_path)# Define a new class object named 'station':stati on =Weather_Station(df)# Visualize data:#station.data_visualization()# Artificial Neural Network (ANN):station.Neural_Network(False)# Enter inputs for making predictions:prediction_array =np.array([ [0, 0, 0.31819805, 0.31819805, 0.6988, 0.81498571, 0.99349753], [0, -0, 0, -0, 0.8444, 1, 0.96835143], [0, 0, 0.45, 0, 0.87577, 0.95857143, 1.00128332], [-0, -0, -0, -0, 0.8224, 1.05714286, 0.99279368]])# Prediction Results:station.make_prediction(prediction_array) ESP12E_remote_weather_station.inoArduino
///////////////////////////////////////////// // IoT Weather Station Predicting // // Rainfall Intensity w/ TensorFlow // // ------------------------ // // NodeMCU (ESP-12E) // // by Kutluhan Aktar // // // ///////////////////////////////////////////////// Collates weather data on Google Sheets and interprets it with a neural network built in TensorFlow to make predictions on the rainfall intensity. //// For more information:// https://www.theamplituhedron.com/projects/IoT_Weather_Station_Predicting_Rainfall_Intensity_with_TensorFlow//// Connections// NodeMCU (ESP-12E) :// Weather Station// VV --------------------------- 5V// D5 --------------------------- RX// D6 --------------------------- TX// G --------------------------- GND// Include required libraries:#include#include #include #include #include // Define your WiFi settings.const char *ssid =" ";const char *password =" ";// Define weather station settings:char databuffer[35];double temp;int transferring =0;// Define the serial connection pins - RX and TX.SoftwareSerial Serial_1(D6, D5); // (Rx, Tx)void setup() { // Wait until connected. delay(1000); // Initiate serial ports:Serial.begin(115200); Serial_1.begin(9600); // It is just for assuring if connection is alive. WiFi.mode(WIFI_OFF); delay(1000); // This mode allows NodeMCU to connect any WiFi directly. WiFi.mode(WIFI_STA); // Connect NodeMCU to your WiFi. WiFi.begin(ssid, password); Serial.print("\n\n"); Serial.print("Try to connect to WiFi. Please wait! "); Serial.print("\n\n"); // Halt the code until connected to WiFi. while(WiFi.status()!=WL_CONNECTED){delay(500); Serial.print("*"); } // If connection is successful:Serial.print("\n\n"); Serial.print("-------------------------------------"); Serial.print("\n\n"); Serial.print("Connection is successful!"); Serial.print("\n\n"); Serial.print("Connected WiFi SSID :"); Serial.print(ssid); Serial.print("\n\n"); Serial.println("Connected IPAddress :"); Serial.println(WiFi.localIP()); Serial.print("\n\n");}void loop() { // Get data from the remote weather station:getBuffer(); // Debug the information and create the link:String weather_data ="wd=" + String(WindDirection()) + "&a_ws=" + String(WindSpeedAverage()) + "&m_ws=" + String(WindSpeedMax()) + "&1_rf=" + String(RainfallOneHour()) + "&24_rf=" + String(RainfallOneDay()) + "&tem=" + String(Temperature()) + "&hum=" + String(Humidity()) + "&b_pr=" + String(BarPressure()); String server ="http://192.168.1.24/remote_weather_station/?"; Serial.println("Weather Data => " + weather_data); Serial.println("Buffer => " + String(databuffer)); // Send data packets every 5 minutes to Raspberry Pi (or any server). transferring++; Serial.println("Time => " + String(transferring) + "s / " + String(int(5*60)) + "s\n\n"); if(transferring ==5*60){ // Create the HTTP object to make a request to the server. HTTPClient http; http.begin(server + weather_data); int httpCode =http.GET(); String payload =http.getString(); Serial.println("Data Send...\nHTTP Code => " + String(httpCode) + "\nServer Response => " + payload + "\n\n"); http.end(); transferring =0; } // Wait 1 second... delay(1000);}// WEATHER STATIONvoid getBuffer(){ int index; for (index =0;index <35;index ++){ if(Serial_1.available()){ databuffer[index] =Serial_1.read(); if (databuffer[0] !='c'){ index =-1; } } else{ index --; } }}int transCharToInt(char *_buffer, int _start, int _stop){ int _index; int result =0; int num =_stop - _start + 1; int _temp[num]; for (_index =_start;_index <=_stop;_index ++){ _temp[_index - _start] =_buffer[_index] - '0'; result =10*result + _temp[_index - _start]; } return result;}int WindDirection(){ return transCharToInt(databuffer,1,3); } // Wind Direction (deg)float WindSpeedAverage(){ temp =0.44704 * transCharToInt(databuffer,5,7);温度を返す; } // Average Air Speed (1 minute)float WindSpeedMax(){ temp =0.44704 * transCharToInt(databuffer,9,11);温度を返す; } //Max Air Speed (5 minutes)float Temperature(){ temp =(transCharToInt(databuffer,13,15) - 32.00) * 5.00 / 9.00;温度を返す; } // Temperature ("C")float RainfallOneHour(){ temp =transCharToInt(databuffer,17,19) * 25.40 * 0.01;温度を返す; } // Rainfall (1 hour)float RainfallOneDay(){ temp =transCharToInt(databuffer,21,23) * 25.40 * 0.01;温度を返す; } // Rainfall (24 hours)int Humidity(){ return transCharToInt(databuffer,25,26); } // Humidity (%)float BarPressure(){ temp =transCharToInt(databuffer,28,32);戻り温度/10.00; } // Barometric Pressure (hPA)
SIM808_remote_weather_station.inoArduino
///////////////////////////////////////////// // IoT Weather Station Predicting // // Rainfall Intensity w/ TensorFlow // // ------------------------ // // Arduino Uno (SIM808) // // by Kutluhan Aktar // // // ///////////////////////////////////////////////// Collates weather data on Google Sheets and interprets it with a neural network built in TensorFlow to make predictions on the rainfall intensity. //// For more information:// https://www.theamplituhedron.com/projects/IoT_Weather_Station_Predicting_Rainfall_Intensity_with_TensorFlow//// Connections// Arduino Uno:// SIM808 GPS/GPRS/GSM Shield For Arduino// D0 --------------------------- RX// D1 --------------------------- TX// D12 --------------------------- POWER // Weather Station// 5V --------------------------- 5V// D5 --------------------------- RX// D6 --------------------------- TX// GND --------------------------- GND// Include required libraries:#include#include // Define the sim808.DFRobot_SIM808 sim808(&Serial);// Define weather station settings:char databuffer[35];double temp;int transferring =0;// Define the serial connection pins - RX and TX.SoftwareSerial Serial_1(6, 5); // (Rx, Tx)void setup() { // Wait until connected. delay(1000); // Initiate serial ports:Serial.begin(9600); Serial_1.begin(9600); //******** Initialize sim808 module ************* while(!sim808.init()) { delay(1000); Serial.print("Sim808 init error\r\n"); } delay(2000); // Continue if the SIM808 Module is working accurately. Serial.println("Sim808 init success"); delay(5000);}void loop() { // Get data from the remote weather station:getBuffer(); // Debug the information and create the link:String weather_data_1 ="wd=" + String(WindDirection()) + "&a_ws=" + String(WindSpeedAverage()) + "&m_ws=" + String(WindSpeedMax()); String weather_data_2 ="&1_rf=" + String(RainfallOneHour()) + "&24_rf=" + String(RainfallOneDay()) + "&tem=" + String(Temperature()); String weather_data_3 ="&hum=" + String(Humidity()) + "&b_pr=" + String(BarPressure()); Serial.print("Weather Data => " + weather_data_1); Serial.print(weather_data_2); Serial.println(weather_data_3); Serial.println("Buffer => " + String(databuffer)); // Send data packets every 5 minutes to the server. transferring++; Serial.println("Time => " + String(transferring) + "s / " + String(int(5*60)) + "s\n\n"); if(transferring ==5*60){ //*********** Attempt DHCP ******************* while(!sim808.join(F("cmnet"))) { Serial.println("Sim808 join network error!"); delay(2000); } //************ Successful DHCP **************** delay(5000); Serial.println("Successful DHCP"); //*********** Establish a TCP connection ************ if(!sim808.connect(TCP,"192.168.1.24", 80)) { // Change it with your server. Serial.println("Connection Error"); }else{ Serial.println("Connection OK"); } delay(2000); //*********** Send a GET request ***************** String line ="GET /remote_weather_station/?" + weather_data_1 + weather_data_2 + weather_data_3 + " HTTP/1.0\r\n\r\n"; Serial.println(line); char buffer[512]; // Convert the line from string to char array to make an HTTP Get Request with the SIM808. char web_hook[110]; String_to_Char(line, 110, web_hook); sim808.send(web_hook, sizeof(web_hook)-1); while (true) { int ret =sim808.recv(buffer, sizeof(buffer)-1); if (ret <=0){ Serial.println("Fetch Over...");壊す; } // Uncomment to view the response in the serial monitor. /* buffer[ret] ='\0'; Serial.print("Recv:"); Serial.print(ret); Serial.print(" bytes:"); Serial.println(buffer); */ Serial.println("\nData Send");壊す; } //************* Close TCP or UDP connections ********** sim808.close(); //*** Disconnect wireless connection, Close Moving Scene ******* sim808.disconnect(); // Exit. transferring =0; } // Wait 1 second... delay(1000);}// WEATHER STATIONvoid getBuffer(){ int index; for (index =0;index <35;index ++){ if(Serial_1.available()){ databuffer[index] =Serial_1.read(); if (databuffer[0] !='c'){ index =-1; } } else{ index --; } }}int transCharToInt(char *_buffer, int _start, int _stop){ int _index; int result =0; int num =_stop - _start + 1; int _temp[num]; for (_index =_start;_index <=_stop;_index ++){ _temp[_index - _start] =_buffer[_index] - '0'; result =10*result + _temp[_index - _start]; } return result;}int WindDirection(){ return transCharToInt(databuffer,1,3); } // Wind Direction (deg)float WindSpeedAverage(){ temp =0.44704 * transCharToInt(databuffer,5,7);温度を返す; } // Average Air Speed (1 minute)float WindSpeedMax(){ temp =0.44704 * transCharToInt(databuffer,9,11);温度を返す; } //Max Air Speed (5 minutes)float Temperature(){ temp =(transCharToInt(databuffer,13,15) - 32.00) * 5.00 / 9.00;温度を返す; } // Temperature ("C")float RainfallOneHour(){ temp =transCharToInt(databuffer,17,19) * 25.40 * 0.01;温度を返す; } // Rainfall (1 hour)float RainfallOneDay(){ temp =transCharToInt(databuffer,21,23) * 25.40 * 0.01;温度を返す; } // Rainfall (24 hours)int Humidity(){ return transCharToInt(databuffer,25,26); } // Humidity (%)float BarPressure(){ temp =transCharToInt(databuffer,28,32);戻り温度/10.00; } // Barometric Pressure (hPA)void String_to_Char(String _String, int _size, char _convert[]){ for(int i=0;i<_size;i++){ _convert[i] =_String[i]; }}
index.php (web application)PHP
 (int)$_GET['wd'], "a_ws" => (float)$_GET['a_ws'], "m_ws" => (float)$_GET['m_ws'], "1_rf" => (float)$_GET['1_rf'], "24_rf" => (float)$_GET['24_rf'], "tem" => (float)$_GET['tem'], "hum" => (int)$_GET['hum'], "b_pr" => (float)$_GET['b_pr'] ];}else{ $variables_from_module =[ "wd" => "err", "a_ws" => "err", "m_ws" => "err", "1_rf" => "err", "24_rf" => "err", "tem" => "err", "hum" => "err", "b_pr" => "err" ];}/** * Returns an authorized API client. * @return Google_Client the authorized client object */function getClient(){ $client =new Google_Client(); $client->setApplicationName('Remote Weather Station'); // Enter your application name. $client->setScopes('https://www.googleapis.com/auth/spreadsheets'); $client->setAuthConfig('credentials.json'); $client->setAccessType('offline'); $client->setPrompt('select_account consent'); // Load previously authorized token from a file, if it exists. // The file token.json stores the user's access and refresh tokens, and is // created automatically when the authorization flow completes for the first // time. $tokenPath ='token.json'; if (file_exists($tokenPath)) { $accessToken =json_decode(file_get_contents($tokenPath), true); $client->setAccessToken($accessToken); print("Token Found!"); } // If there is no previous token or it's expired. if ($client->isAccessTokenExpired()) { // Refresh the token if possible, else fetch a new one. if ($client->getRefreshToken()) { $client->fetchAccessTokenWithRefreshToken($client->getRefreshToken()); } else { // Request authorization from the user. $authUrl =$client->createAuthUrl(); // Do not forget to refresh the page after getting the verification code and entering it to the account_verification_token.php. printf("Open the following link in your browser:

%s

", $authUrl); // <=Comment print 'Do not forget to refresh the page after getting the verification code and entering it to the account_verification_token.php.

Set the verification code in the account_verification_token.php file.'; // <=Comment // Set the verification code to create the token.json. $authCode =trim($GLOBALS['account_verification_token']); // Exchange authorization code for an access token. $accessToken =$client->fetchAccessTokenWithAuthCode($authCode); $client->setAccessToken($accessToken); // Check to see if there was an error and the account_verification_token is entered. if (array_key_exists('error', $accessToken)) { throw new Exception(join(', ', $accessToken)); }else{ print("Successful! Refresh the page."); } } // Save the token to a file. if (!file_exists(dirname($tokenPath))) { mkdir(dirname($tokenPath), 0700, true); } file_put_contents($tokenPath, json_encode($client->getAccessToken())); } return $client;}// Get the API client and construct the service object.$client =getClient();$service =new Google_Service_Sheets($client);// Enter your spreadsheetId:$spreadsheetId ='';// Enter the range (the first row) under which new values will be appended (8 rows):$range ='A1:H1';// Append recent findings from the weather station to the spreadsheet.$values =[ [$variables_from_module["wd"], $variables_from_module["a_ws"], $variables_from_module["m_ws"], $variables_from_module["1_rf"], $variables_from_module["24_rf"], $variables_from_module["tem"], $variables_from_module["hum"], $variables_from_module["b_pr"]]];$body =new Google_Service_Sheets_ValueRange([ 'values' => $values]);$params =[ 'valueInputOption' => "RAW"];// Append if only requested!if(isset($_GET['wd']) &&isset($_GET['a_ws']) &&isset($_GET['m_ws']) &&isset($_GET['1_rf']) &&isset($_GET['24_rf']) &&isset($_GET['tem']) &&isset($_GET['hum']) &&isset($_GET['b_pr'])){ $result =$service->spreadsheets_values->append($spreadsheetId, $range, $body, $params); printf("

%d cells appended.", $result->getUpdates()->getUpdatedCells());}else{ print ("
Missing Data!");}
account_verification_token.php (web application)PHP
"; // Enter the verification code after authorization. ?>
カスタムパーツとエンクロージャー
remote_weather_station_OobOCQNPSW.csv 回路図
製造プロセス
- ラズベリーパイをベースにした気象観測所
- Raspberry Pi2ウェザーステーション
- ラズベリーパイウェザーステーション
- IoT 101プロジェクト:RaspberryPiからのストリーム温度
- RaspberryPiを使用した天気のリモートモニタリング
- 気象台とIOTに参加– CWOP
- Java ME 8 + Raspberry Pi +センサー=IoT World(パート1)
- DHT11センサーを接続するRaspberryPIベースのIoTプロジェクト
- Raspberry Pi2上のWindows10 IoT Core –Adafruitセンサーデータ
- Weather Station V 2.0
- Windows 10 IoT Core for Raspberry Pi3モデルB +