


植物の知性とビール!
Sure Controls に自家製のビール マシンがあることは (それほどではありませんが) よく秘密にされています。ビールマシンは、お客様に提供する施設ツアーのハイライトです。私たちのプラント インテリジェンス機能のいくつかを実証するための非常にクールな方法でもあると思いました!数週間前、常駐の醸造マスターであるジョシュがいくつかのバッチを醸造しました.彼がビールを醸造している間、顧客プロジェクトの内部テストに使用する社内のヒストリアンを接続し、それを使用してデータを収集しました。この記事で私が実証したいのは、データを通信するプロセスに接続する方法と、データが収集されたら、データを表示するためにどのような方法を使用できるかということです.
パート 1 – データの収集
以前のブログ「Demystifying Data Collection」で、標準とプロトコルについて詳しく説明しました。ここでは詳しく説明しませんが、この演習は、お客様のために実行するプロジェクトへのアプローチ方法の良い例です。最初に、醸造マスターのジョシュと一緒に、収集する必要がある重要な情報はどれかを判断しました。醸造工程は基本的に「もろみ」「煮込み」「割る」の3段階。これらの手順で監視する重要な項目は温度です。また、プロセスのどの段階にいるかをデータ収集システムに伝える方法も必要でした。
温度データを収集するために、ビール製造機を分析したところ、調理容器のヒーターを制御するために温度コントローラーが配線されていることがわかりました。プロセスで使用されます。幸いなことに、これらのコントローラーには通信機能があるため、あとは必要な標準とプロトコルを決定するだけでした。これらの特定のコントロールは、Modbus を通信プロトコルとして使用します。 Modbus は非常に一般的で話しやすいので、これは素晴らしいことです。私たちが抱えていた課題の 1 つは、コントローラー自体が通信にシリアル リンクのみを使用し、Historian サーバーが少し離れていたことです。これを解決するために、シリアルから TCP/IP へのゲートウェイ デバイスを使用しました。これにより、Historian サーバーは Modbus TCP を使用してコントロールと直接通信し、必要な温度データを収集できるようになりました。次に、プロセス ステップの質問を解決します。
プロセスのどのステップにいるかを把握するために、小型の PLC と HMI を使用することにしました。幸いなことに、アプリケーションのテストに使用する小さな PLC と、セールス デモに使用する HMI が近くにありました。テキストデータを保持するレジスタを使用して PLC をプログラムしました。 We then programmed the HMI with some simple buttons for our brew master Josh to select which step of the brewing process he was in. By pressing the “Mash” button for example, the HMI would then write the value “Mash” into the register programmed in the PLC. The PLC was connected to the Ethernet network, and Historian could then read the register directly logging the process step. This will aid later when viewing the data, in order to give it context.
Part 2 – We have data – now what?
Once the batch of beer was brewed, we used the process steps logged by the PLC as our flags for pulling the data. By noting when the process steps change, we could capture the start and end points for each step of the process. We then brought up each step of the process in a trend view:
The Mash
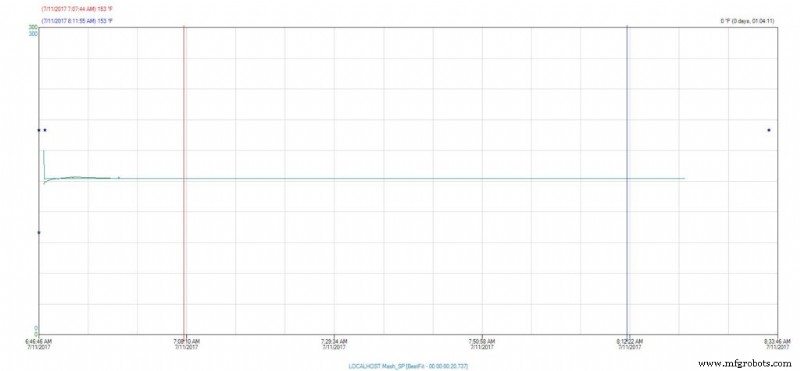
Here we can see that during the Mash phase of the brewing process, our temperature maintained a steady 153° Fahrenheit.
The Boil
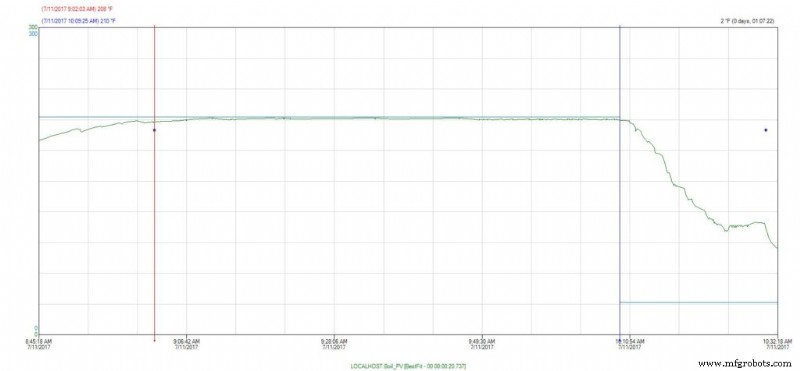
The same thing holds true for the boil phase, our temperature holds at a steady 210° Fahrenheit.
The Break
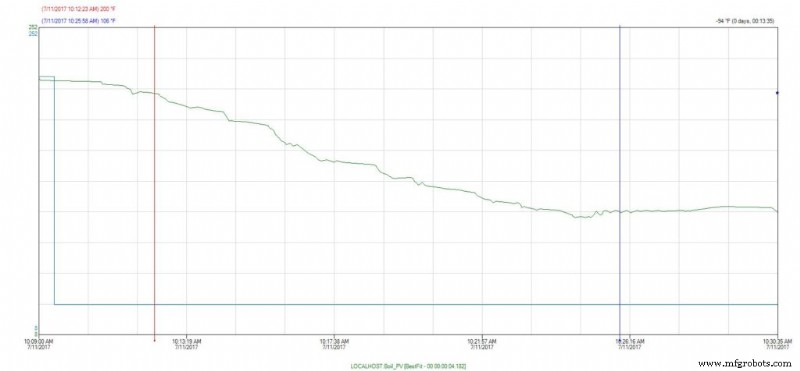
This step is considered critical to the brewing phase, as it is important to bring the Wort (this is what the liquid is called during the brewing process – it’s not beer yet) down to a temperature where it is safe to pitch the yeast. We can see here by our trend that it took approximately 13 minutes to bring the Wort from 200° down to 100° Fahrenheit. All in all, it appears our brew master did an excellent job with this particular batch of beer.
Let’s talk a bit more about the data. We used trends for our initial analysis. Presenting the data visually in this way allow us to quickly spot any anomalies that might have cropped up during the process. If, for example, during the boil phase, if we saw a sudden drop in temperature for a small period of time, then we would start to ask what happened? Did a fuse pop, causing an actual loss in temperature, thus putting the batch in peril? Or did a sensor become detached and thus the data is skewed, but once reattached we could see the temperature was holding constant, so the batch is likely okay? This kind of analysis can become very useful in identifying “what went wrong” if something didn’t pass quality tests for example.
So, what if we just want a simple summary of what happened during the batch? Using the Query tool from our Historian client, I can do a simple summary like this:
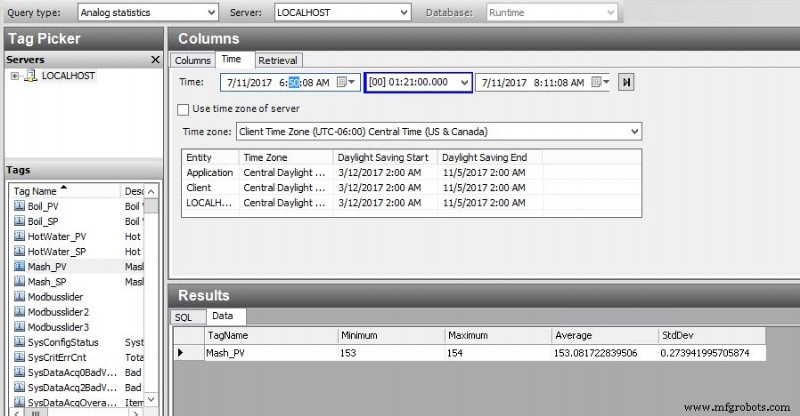
This is a very simple statistical analysis of the temperature of our Wort during the Mash phase. I pulled Min, Max, Average and Standard Deviation. This gives us a great one line view of what happened. I can see that the temperature stayed within one degree of setpoint, and averaged almost exactly at setpoint for the duration of the time.
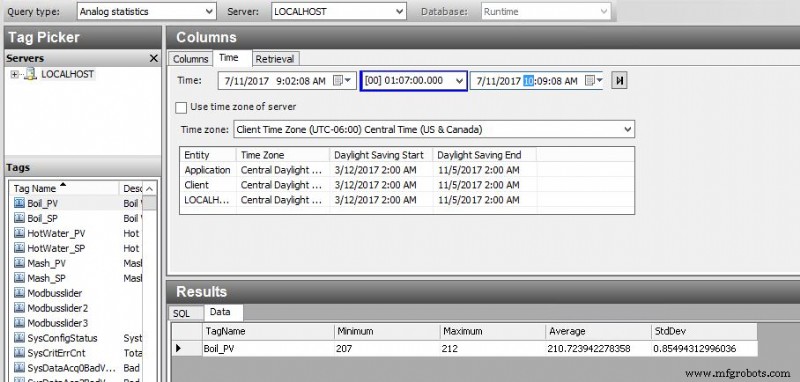
I can see that there is a slightly larger variation during our Boil process, but still well within acceptable parameters.
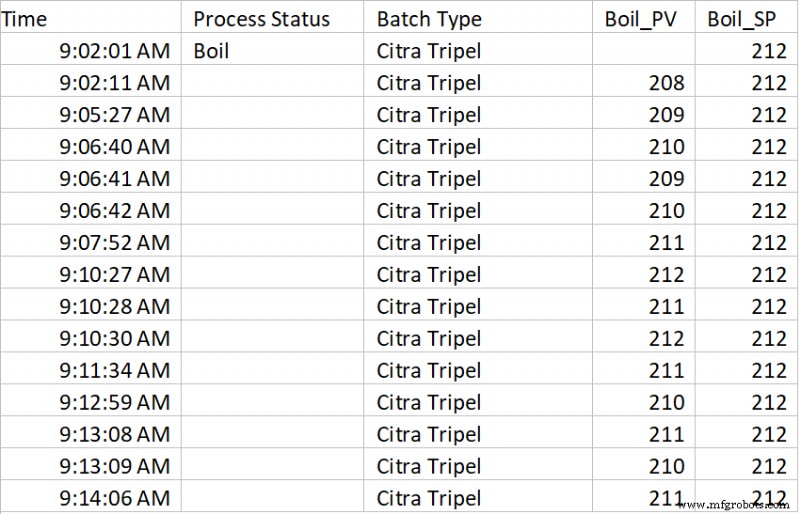
Finally, if I really want to do a “deep dive” into the data, I can easily export to Excel which is a familiar tool and I can view the raw data directly, create my own charts and reports for doing additional analysis:
Some additional “Tips and Tricks” for data collection. If we were a real brewery, it would be a very good idea to assign a batch number to this batch, and log that value to Historian as well. Then, the next time I brewed the type of beer “Citra Tripel”, I could go back and compare my latest batch to the previous batch. If my beer taster(s) note anything extraordinary about a particular batch, we can then analyze what happened, and then update our recipe in order to replicate that improvement in future batches, or just compare how we did. Also, using the trend tool, we can pull up data from both batches simultaneously using the “time offset” feature, allowing a nice detailed visual comparison by overlaying both batches within the same trend.
I hope you enjoyed this article. This really just scratches the surface for what automated data collection can do for process improvement. In a future article, I will discuss additional techniques for capturing downtime data and analyzing causes. In addition, I will talk about how we can leverage the data collection system to notify our process team when an event is occurring, instead of analyzing what happened “after the fact”.
自動制御システム