


Mimosa tenuiflora抽出物を使用した金ナノ粒子の合成、細胞毒性、細胞取り込み、および触媒作用の評価
要約
植物抽出物を用いた金ナノ粒子(AuNPs)の合成は、その多種多様な健康用途により、生物医学の分野で大きな関心を集めています。本研究では、AuNPは Mimosa tenuiflora で合成されました。 (Mt)さまざまな金属前駆体濃度の樹皮抽出物。 Mt抽出物は、樹皮をエタノール-水に混合することによって得られました。抽出物の抗酸化能は、2,2-ジフェニル-1-ピクリルヒドラジルと総ポリフェノールアッセイを使用して評価されました。 AuNPは、透過型電子顕微鏡法、X線回折、UV-Visおよびフーリエ変換赤外分光法、および表面への官能基測定のためのX線光電子分光法によって特徴づけられました。 AuMt(AuNPとMtの分子によって形成されるコロイド)は、20〜200nmのサイズの複数の形状を示します。 AuMtは、水素化ホウ素ナトリウムを添加した均一系触媒作用でのメチレンブルー分解についてテストされました。最小のNP(AuMt1)の劣化係数は0.008 / sで、190 s で50%の劣化に達します。 。細胞生存率と細胞毒性は、ヒト臍帯静脈内皮細胞(HUVEC)で評価され、24時間と48時間で中程度の細胞毒性効果が見られました。ただし、毒性は用量依存的には作用しません。 HUVEC細胞上のAuMtの細胞内在化は、共焦点レーザー走査顕微鏡によって分析されました。 AuMt1の場合、物質が細胞質に分散しているのに対し、AuMt2の場合、物質は核周辺に集中していることが観察できます。
はじめに
植物を介したナノマテリアルの生合成は、ワンポットプロセスでNP合成を可能にする環境に優しい方法です。これは、植物抽出物の同じ生体還元剤が、毒性化合物の割合が低い形成された粒子の安定剤として機能するためです[1,2,3]。この意味で、ミモザテヌイフローラ (山)樹皮は、4つのフラボノイド単位[4]、サポニン、ブドウ糖、アルカロイド( N )の構造を持つ縮合型タンニンを多く含んでいます。 、 N -ジメチルトリプタミン)、およびデンプン[5,6,7,8]。これらの化合物(縮合型タンニン)は金属イオン還元剤として作用する可能性がありますが、特にフラボノイドは金属錯体化に関連しています[4]。
Mtエタノール抽出物は、グラム陰性菌、グラム陽性菌、および酵母菌の抗菌剤として使用されてきました[9]。また、抗原虫薬(山の葉や花のフラボノイドを使用)[10]や皮膚の再生[6]として。さらに、それは、その特性が山樹皮の分子とポリフェノールに起因する重度の皮膚潰瘍を治癒する可能性があります[11]。植物抽出物は、抗酸化剤のような特性を示し、特に、Au、Ag、Fe、Pt、Pd、Cu、それらの合金、酸化物などの金属NPのグリーン合成に使用されるポリフェノールを含みます[12、13]。表面プラズモン共鳴(SPR)の共鳴周波数としてのNPシステムの光学特性は、ナノ材料の固有の特性(サイズ、形状、誘電率)だけでなく、NPを取り巻く環境特性にも依存します。 NPをカバーする安定化分子の分散または性質。これらのパラメータは、NPシステムにおけるSPRのピーク位置を定義するために決定的です[14、15、16]。
一方では、AuNPの触媒特性は、農薬、フェノール化合物、染料などの有機化合物の分解に関連するいくつかの研究で報告されており[17、18、19]、環境修復に関連する触媒プロセスで使用されます。汚染された水の洗浄として[20]。近年、ブラックカルダモンとして植物抽出物を用いて合成されたAuNP [21]や、メチレンブルー(MB)[22]、メチルオレンジ[19]、ローダミンなどの業界で使用される染料分解における触媒活性評価に関するいくつかの報告が出ています。 B [23]。しかし、反対の方向で、いくつかの論文は、安定化分子でコーティングされたNPは、有機分子によって占められたNP表面の触媒作用に利用できる部位のために不十分な触媒活性を示したと報告しています[24、25]。また、AuNPは、有毒金属イオンの比色検出[7]や治療(治療および診断)アプリケーション[26]などの分子センサーとして使用されています。
表面に分子を持つ機能化されたAuNPは、その特徴を定義する組成、厚さ、組織、およびコンフォメーションに関連する光学的および生物学的特性を示します[27]。ナノテクノロジーには、血流上のAuNPの凝集など、さまざまな課題があります[28]。濃度が20μg/ mL未満でサイズが約20nmのAuNPは、健康な癌細胞株では細胞毒性効果を示さず、それらを使用することでNPと細胞間の相互作用を分析することができます[13、29、30]。次に、ナノテクノロジーは、同じスケールの細胞受容体[31]で相互作用する可能性を提供します。これにより、細胞プロセス[32、33]および抗菌特性[34]について、たとえば、酸化ストレスにおいて、シグナル伝達のカスケードを生成します。細胞毒性や抗酸化防御反応などのさまざまな効果[35]。さらに、機能化されたAuNPは、薬物、遺伝子、またはタンパク質のトランスポータービヒクルとして機能し[36]、生物医学的用途[37、38]として機能します。さらに、タンパク質およびポリマーとしてのAuNPsリガンドは、細胞質、核に到達する、または膜を越えないようにするためにNPの内部移行を促進する化学的環境を生成します[39]。
この作業では、AuNPsは豊富なポリフェノールMt樹皮抽出物を使用して合成されました。 AuMt細胞毒性は、HUVEC細胞で評価され、細胞内在化は、24時間で共焦点顕微鏡によって監視されました。水素化ホウ素ナトリウム(NaBH 4 )の存在下でのMB分解に対するAuMt触媒活性 )室温で評価した。私たちの結果は、「グリーン」な方法で合成されたAuNPを使用した同様の触媒作用に関して比較されました。
材料と方法
材料と化学物質
AuMt合成では、15 gのMt樹皮を細かく切り、100mLフラスコに入れました。 70ミリリットルのエタノール(フェルモン、純度99%)と30 mLの超純水(18MΩ、ミリポア)を加え、アルミニウムで覆い、室温で15日間放置しました。溶液はワットマン濾紙(8μm)を使用して濾過し、その後アクロディスク(0.20μm)を使用して濾過しました。得られた溶液をAuMt合成用の還元剤(Mt抽出物)として使用した。ろ液の一部を回転蒸発させた後、凍結乾燥してDPPHと総ポリフェノールアッセイを行い、Mt抽出物の検量線を作成しました。 Mt抽出物の濃度は32.5mg / mLで、検量線から決定されました。テトラクロロ金酸(HAuCl 4 、Sigma-Aldrich 99%純度)を金属前駆体として使用しました。合成に使用された前駆体の濃度は、AuMt1では5.3 mM、AuMt2では2.6mMでした。還元剤の量は一定(1.6 mL)に保たれ、サンプルの総量は超純水で6mLになりました。追加ファイル1:表S1は、AuMt1およびAuMt2合成で使用される配合と、各反応物のpH値を示しています。合成は、実験室の照明条件下で25°Cで実行されました。使用したプロトコルは次のとおりです。 50 mLチューブに、Mt抽出液を加え、続いて超純水を加え、最後に金前駆体溶液を加え、3000rpmで10秒間ボルテックスですぐに攪拌します。 AuMtNPsの合成は、混合物の色の変化によって数分以内に視覚的に確認されました。 NPの洗浄プロセスは、懸濁液を14,000 rpmで1時間遠心分離し、上澄みを捨て、水を加え、超音波処理によって分散させ、このプロセスを2回繰り返すことで構成されます。エタノールを加えた後、AuMtを超音波処理により再度分散させ、14,000rpmで1時間遠心分離します。上澄みを捨てて沈殿させ、40℃のオーブンで乾燥させます。次に、得られたナノコンポジットは、表面にMt抽出分子を含むAuNPで構成されます。
AuMtNP合成の時間依存pH変化
反応を実施しながら、AuMtNP合成のpHを測定した。このために、マルチパラメーターpH /導電率ベンチトップメーター(Orion™VERSASTAR™)が使用されました。機器は、pH =4.01での校正用の緩衝液参照標準溶液を使用して25°Cで校正されました。再循環槽を使用して、すべての測定でサンプルの温度を25°C(±0.1°C)に制御しました。試薬を混合した直後に180秒間反応を行ったため、pHを測定しました。同じデバイスが反応物のpH測定に使用されました。
UV-Visスペクトル、2,2-ジフェニル-1-ピクリルヒドラジル(DPPH)、および総ポリフェノールアッセイ
ダブルビームのPerkin-ElmerLambda 40 UV / Vis分光計を使用して、200〜400 nmの測定範囲で、240 nm / minのスキャン速度で抽出物のUV-Visスペクトルを取得しました。 AuMt SPRは250〜875nmで監視されました。
AuMt形成速度は、磁気攪拌下で石英セル内でNP合成反応が発生する間、毎秒550nmでの吸光度を測定することによって決定されました。
DPPHアッセイの場合、すべてのテストは3回行った。さまざまなMt抽出物濃度(25、12.5、6.25、および3.125μg/ mL)をテストしました。 DPPH溶液(300μM)に加えて、100マイクロリットルのエタノールを各濃度の100μLに添加しました。続いて、517 nmでの吸光度を測定する前に、サンプルを暗所で2時間インキュベートしました。結果をビタミンCおよびカテキン(70μmol/ L)と比較し、両方の分子をコントロールとして使用しました。スカベンジング活性については、エタノールに溶解したDPPHラジカルをブランクとして使用しました[40、41]。清掃活動の割合は、式(1)を使用して計算されました。 (1)。
$$ \%\ mathrm {Scavenging} \ \ mathrm {activity} =\ left [\ left(1- \ mathrm {A} \ \ mathrm {sample} \ right)/ \ mathrm {A} \ \ mathrm {control} \ right] \ times 100 $$(1)ここで、サンプル はサンプルの吸光度であり、コントロールです。 ブランクの吸光度です。データは、分散分析(ANOVA)とTukey多重比較検定を使用して分析されました。
総ポリフェノールアッセイでは、0.25 NのFolin-Ciocalteuと5%の炭酸ナトリウムを添加し、光のない状態で1時間インキュベートすることにより、同じ濃度を使用しました。吸光度は750nmで測定されました。結果は没食子酸当量として表されます[42、43]。
ゼータ電位とDLSサイズの決定
NPのゼータ電位(ζ)はZetasizer NS(Malvern、PA)で測定し、サイズはZetasizer NS(分解能0.5 nm)の動的光散乱(DLS)で測定しました。機器は、電気泳動移動度(μ)を決定することによってζを計算します e )ヘンリー方程式を使用します。 (2)[44]:
$$ {\ mu} _e =\ frac {2 \ varepsilon \ zeta f(ka)} {3 \ eta} $$(2)ここで、ε 、η 、および f (ka)は、それぞれ、媒体の誘電率、媒体の粘度、およびヘンリーの関数を示します。 f の近似値として、通常2つの値が使用されます。 (ka)決定、1.5または1.0。 ζの電気泳動測定は、最も一般的には水性溶媒と中程度の電解質濃度で行われます。 f (ka)この場合、値は1.5であり、古典的なスモルコフスキー近似と呼ばれます。 (3)[45]。
$$ {\ mu} _e =\ varepsilon \ frac {\ upzeta} {\ upeta} $$(3)サンプルは、ζのU字型の折り畳まれたキャピラリーセルに入れられました。 測定。各サンプルは、室温(25°C)で3回測定されました。
補足培地(s-DMEM)でのNP安定性の評価
AuMtNPの安定性は、s-DMEMでDLSおよびζによって評価されました。 。流体力学的直径(2R H )AuMt1およびAuMt2は、超純水およびs-DMEMで25〜200μg / mLの濃度で37°Cで測定されました。 s-DMEM中のAuMt1およびAuMt2の場合、培地がNP表面電荷を変化させるかどうかを確認するために、ζを37°Cで測定しました。ナノ粒子は、事前に熱化されたs-DMEMを含むエッペンドルフチューブに添加され、3000rpmで30秒間ボルテックスで攪拌されました。同じ温度で測定を行う前に、37°Cでのインキュベーションを15分間維持します。
フーリエ変換赤外分光法(FTIR)
Mt抽出物とAuMtFTIRは、固体サンプルを使用してPerkin-Elmer FrontierFTIRによって取得されました。スペクトルは、2 cm − 1 の分解能で透過率モードで取得されました。 、4500〜500 cm -1 。
X線光電子分光法(XPS)
XPS実験は、Perkin-Elmer(モデルPHI 5100、Ag3d5 / 2ピーク0.80eVのFWHMに基づく分解能、XRソースデュアルスタンダードアノード(Mg / Al)、および15 kV、300 W、20 mA)を使用して実行されました。 )。調査スキャン分析は、0.5 eV / sのスキャンレートで実行されました。高解像度の分析には、0.025 eV / sのスキャンレートが使用されました。
透過型電子顕微鏡(TEM)
TEMの場合、10μLのサンプルをfomvar-carbonフィルム(Electron Microscopy Sciences、300メッシュ)で覆われた銅グリッド上に堆積させました。グリッドを1時間乾燥させ、真空チャンバーに12時間置きます。電子顕微鏡装置は、200keVで動作する電界放出Jeol2010Fです。エネルギー分散型X線分光法(EDS)は、検出器Bruker Quantax 200であり、ペルチェ冷却され、TEMシステムに結合されています。高分解能TEM(HRTEM)によって明らかにされた結晶面の面間隔は、顕微鏡写真デジタル分析(3.0 Gatanバージョン)によって決定されました。
X線回折
データは、多層ミラーモノクロメーターを備えたBruker D8 QUEST回折計システムと、CuKαマイクロフォーカスシールチューブ(λ)を使用して収集されました。 =1.54178Å)。フレームは T で収集されました =スキャンによる300K。
AuMt細胞毒性効果
AuMt細胞毒性効果は、3-(4,5-ジメチルチアゾリル-2)-2,5-ジフェニルテトラゾリウムブロミド(MTT)アッセイを使用してHUVEC細胞で評価されました。細胞は、37°Cおよび5%のCO 2 で10%ウシ胎児血清(GibcoBRL)を添加したダルベッコ改変イーグル培地(DMEM、Sigma-Aldrich)で増殖させました。 。 HUVEC細胞はノイバウアーチャンバーでカウントされ、生存率はトリパンブルー排除試験(Sigma-Aldrich)によって決定されました。
MTTアッセイでは、細胞を100,000細胞/ mLに調整し、ウェルあたり100μLを96ウェルプレートに配置しました。 AuMt1およびAuMt2は、200、100、50、および25μg/ mLの濃度で評価されました。処理した細胞を37°C、CO 2 の5%で24時間および48時間インキュベートしました。 。インキュベーション時間後、プレートをリン酸緩衝生理食塩水(PBS)で洗浄し、MTT溶液を加えて4時間インキュベートしました。 MTT結晶を溶解するためにジメチルスルホキシド(DMSO)を加えた。 Gen5ソフトウェアを使用して、マルチモードプレートリーダー(Synergy HTX、BioTek)で570nmの吸光度を測定しました。細胞生存率は、式(1)を使用して計算されました。 (4):
$$ \ mathrm {Cell} \ \ mathrm {viability} =\ left(\ mathrm {A} \ \ mathrm {sample} / \ mathrm {A} \ \ mathrm {control} \ right)\ times 100 \%$$ (4)ここで、サンプル はサンプルとコントロールの吸光度です。 ブランクの吸光度です[46、47]。
統計分析
データは平均±標準偏差(SD)として表されます。グループ間の有意差は、必要に応じて一元配置分散分析であるテューキー検定によって分析されました。 P 0.05未満の値は、統計的に有意であると見なされました。 Origin Pro 9.1ソフトウェアは、データ管理、統計分析、およびグラフ生成に使用されます。使用される記号は* p <0.05。治療(AuMt1とAuMt2)と対照群の24時間と48時間のパフォーマンスを比較しました。
生/死アッセイでは、HUVEC細胞をスライドガラスに播種し、AuMt1およびAuMt2で処理しました。 24時間のインキュベーションスライドの後、メーカーの推奨の下で、生/死の生存率/細胞毒性キット(ThermoFisher)を使用してこれらを染色しました。サンプルは、共焦点レーザー走査顕微鏡(CLSM800、Carl Zeiss)で観察されました。
共焦点レーザー走査顕微鏡:AuMtの蛍光
共焦点顕微鏡分析は、倒立顕微鏡Axio Observer.Z1(Carl Zeiss、イエナドイツ)に取り付けられたLSM 800デバイス(Carl Zeiss、イエナドイツ)で実施されました。研究には、それぞれ最大出力が5、10、および5mWの405、488、および640nmの3つのレーザーを使用しました。高感度GaAsP検出器を使用して蛍光を収集した。明視野画像は、光電子増倍管(PMT)で透過したレーザー光を収集することによって取得されました。 AuMt蛍光、生/死アッセイ、およびHUVEC細胞研究でのNP分布には、Plan-アポクロマート×40 /0.95ドライ対物レンズを使用しました。 AuMtを使用した3D再構成セルには、Plan-Aprochronos×63 /1.40オイル対物レンズを使用しました。
AuMt蛍光特性評価では、20μLのNPコロイド分散液をカバーガラスに沈着させ、CLSMによる分析の前に室温で乾燥させました。励起源として640nmのレーザーを0.5%の出力で使用し、蛍光を650〜670nmで収集しました。明視野AuMt画像は、透過光モードで488 nmレーザー(出力の0.2%)を使用して形成されました。蛍光と明視野は別々のトラックに集められました。
セルラー内部化
HUVEC細胞でのAuMtの内在化では、核を4 '、6-ジアミジノ-2-フェニリンドール(DAPI)で染色し、アクチン繊維をフルオレセイン-5-イソチオシネート(FITC)に結合した抗βアクチン抗体で染色して細胞境界を区切りました。 。 DAPIは出力1.0%の405 nmレーザーで励起され、FITCは0.20%の488nmレーザーで励起されました。 DAPIおよび抗βアクチン抗体の放出は、それぞれ410〜500 nmおよび500〜700nmで収集されました。 AuMtは640nmのレーザー(0.50%の出力)で励起され、発光は650〜700nmで収集されました。
3Dセル-AuMt再構成と正射影は、Zスタックモードの30枚の画像から作成されました(合計 Z 長さ=8μm)、上記のようにDAPI、FITC、およびAuMtから蛍光を収集します。蛍光シグナルは、 Z ごとに別々のトラックで収集されました ポジション。わかりやすくするために、3D再構成ではFITC信号を省略しました。
ナノ粒子の細胞取り込みの相対的な比較が実現されました。このため、HUVEC細胞におけるAuMt1とAuMt2の平均蛍光強度は、ImageJソフトウェアを使用した共焦点画像分析から決定されました[48]。
触媒作用
3.33×10 -5 の濃度でのMBに対する触媒活性 Mは、UV-Vis分光法によって分析されました。均一系触媒作用では、90μLのNP(2 mg / mL)がMBと200μLのNaBH 4 を含む石英セルに直接添加されました。 100mMの濃度で。分光光度計セル内で磁石を攪拌することにより、サンプルを均質化した。反応は25℃で行った。
結果と考察
合成
目視検査により、NP合成は両方のシステムで非常に高速であることが検出されました。追加ファイル1の挿入図に示されているAuMt1システムの最も強い色:図S1は、この合成からのNPの含有量が高いことを示しています。これは、AuMt1がAuMt2と比較して2倍の濃度の金属前駆体を持っているためです。追加ファイル1:表S1で、ナノ粒子合成に使用される試薬のpHは酸性です。追加ファイル1:図S1は、AuMtNPs合成が実行されたときの反応のpHの変化を示しています。反応は酸性環境(pH <2.65)で始まり、NP合成が進行するにつれて、酸性度が高まります。これは、Mt抽出物のポリフェノール分子に存在するヒドロキシル基の脱プロトン化によるものです。実際、これは酸化物還元プロセスの最初のステップであり、脱プロトン化されたヒドロキシル基からAu 3+ への電子の移動をもたらします。 イオン。酸化物還元反応の生成物として、Au 3+ イオンは金属原子Au 0 に還元されます そして、2つの電子に寄与するポリフェノール環が酸化されます。このプロセスは、追加ファイル1の挿入図に記載されています:図S1。
UV-Visスペクトル、DPPH、および総ポリフェノールアッセイ
樹皮抽出物のUV-Visスペクトルを図1aに示します。ここで、信号は明確に定義された帯域で構成され、最大値は280 nm、幅は50nmです。このスペクトルは、 Rumex hymenosepalus で報告されたものと非常によく似ています。 ポリフェノール化合物を多く含む根の抽出物[49]。これらの分子はAuNPs合成の還元剤として大きく貢献し、Au 3+ の還元に必要な電子を提供するため、Mt樹皮抽出物のポリフェノール含有量を決定することは重要です。 イオンから金属金(Au 0 )。 NPが形成されると、ポリフェノール化合物がその表面に吸収され、ナノマテリアルに安定性をもたらします。
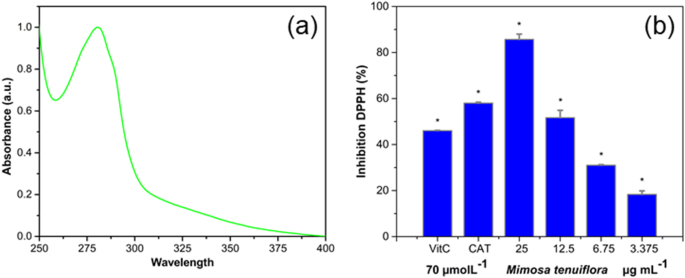
Mt抽出物の特性。 a MtはUV-Visスペクトルと b を抽出します 一元配置分散分析によるDPPH阻害(* p <0.05)
DPPHアッセイでは、12.5 mg / LのMt抽出物で、ビタミンCとカテキンで報告された値(それぞれ46%と58%)と同様に、50%の阻害(L50)が得られたことが観察されました。これは、Mt抽出物が、コントロールとして使用される純粋な化合物と非常によく似た抗酸化能力を持っていることを示しています。図1bでは、有意差があります(* p <0.05)コントロール値からはアスタリスクでマークされています。総ポリフェノールアッセイから得られた425mg / gの値は、抽出された質量のほぼ半分が没食子酸に相当することを示しています。 Mt抽出物の高い抗酸化能と高いポリフェノール含有量は、持続可能な化学の枠組みの中で、優れた還元剤および安定剤のナノ材料合成として使用できることを示唆しています[50、51]。
特性評価
形成の速度論とUV-VisスペクトルAuMt
図2aは、ナノマテリアル合成反応が起こったときの、AuNPのSPRピーク(AuMt1とAuMt2ではそれぞれ550nmと560nm)の吸光度の時間変化を示しています。実験データは、ボルツマンのシグモイド関数[52]に適合しており、少なくとも3段階の成長が観察されます。最初の例では、Au 3+ の場合、合成反応の開始時に吸光度がゆっくりと増加します。 イオンはAu 0 に還元されます 結合して小さなNPを形成するいくつかの原子の集合体を形成します。第2段階では、小さなNPは自己触媒成長によってサイズが大きくなり、吸光度が急速に増加します。最後の段階であるNP再結晶では、吸光度が固定相に達します。図2に示すように、最大吸光度は、AuMt1では60秒、AuMt2では120秒で到達します。興味深いことに、成長の最初の段階はAuMt1では20秒ですが、AuMt2ではほぼヌル(1秒未満)です。これは、金属前駆体に比べて還元分子(Mt抽出物)の比率が高いためです。これは、AuMt1に関してAuMt2のNPにおける核の迅速な形成に有利に働きます。それにもかかわらず、NPの次の成長段階はAuMt2の場合は低く、より大きなサイズのNPが得られます。マルトースとトゥイーン80を安定化として使用するAuNPs合成は、この研究で報告されたものと非常に類似した反応時間で成長速度を示すことが報告されています[53]。別のグリーン合成レポート[54]で、還元剤/前駆体剤の割合が最も低いと、より小さなサイズのNPが生成されることが指摘されています。
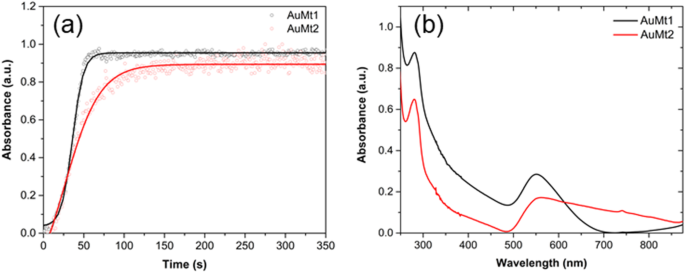
AuMt1およびAuMt2のUV-Vis特性評価。 a 速度論的形成と b UV-Visスペクトル
図2bは、250〜875nmで構成される領域でのAuMtの特徴的な吸収スペクトルを示しています。 AuMt1のSPRは、550nmで最大吸収が200nmの広い対称バンドを示しています。 AuMt2プラズモンのピークは、非対称バンドと300 nmよりも広い幅で、現在560 nmに局在するわずかな赤方偏移を被っています。これは、2つのナノ材料のサイズの違いによるものです(d AuMt1
AuMtNPのサイズ、ゼータ電位、および安定性
表1に示すように、DLSおよびZ電位によるAuMtNPサイズは、1つの濃度(50μg/ mL)でさまざまな条件でテストされました。AuMt1およびAuMt2は、水中で高い負の値(≤30mV)を示し、両方のナノ粒子の静電安定性に有利です。システム。 Quらによると。 [56]、ζ 値はNPサイズとともに徐々に増加します。私たちの場合、AuMt1は水中のAuMt2よりも小さいサイズであり、サイズはNP合成によって制御されます。これらのサイズ値はNP ζと一致します 値。ζが高いほど NP大きいサイズに対応します。ゼータ電位(ζ )s-DMEMに分散したAuMtNPは、超純水で得られた値に比べて負の値が少なくなっています(表1)。この減少は、静電相互作用の減少を引き起こすAuMtNP表面を覆うDMEM存在カチオンおよびFBS存在タンパク質に起因する可能性があります。これにもかかわらずζ 減少すると、値は両方のシステムで− 25 mVに近いままであり、ナノ粒子がs-DMEMインキュベーション後に静電安定性を維持することを示しています[57]。さらに、表1は、AuMtNPの流体力学的直径(2R H )に対してDLSによって得られた結果を示しています。 )超純水および培地で37°Cで測定。 s-DMEMでは、ナノ粒子表面へのタンパク質の吸着により、両方のシステムのサイズが増加しました[58]。 AuMt1の場合、2R H の成長 タンパク質によるコロナは33.8nmで、AuMt2の場合は42.9nmです。ナノ粒子のサイズが大きいほど、タンパク質吸収の表面よりも大きくなると予想されます[59]。これは、ζの値がわずかに小さいことを説明している可能性があります s-DMEMのAuMt1と比較したAuMt2の場合。 AuMt1およびAuMt2の場合、s-DMEMタンパク質との相互作用は、ナノ粒子表面に付着している抽出分子によるものです。 XPSの結果に示されているように、これらの分子はAuMt1とAuMt2の間でわずかに異なります。また、同じ濃度範囲の溶液のpHも測定しました。 pHに変化はなく、超純水中のAuMtとs-DMEMの7.2の両方で平均値が約7.5であることがわかりました(表1)。
<図>追加ファイル1:図S2は、25〜200μg / mLの濃度範囲で、37°Cの超純水およびs-DMEMに分散した場合のAuMtNP流体力学的直径を示しています。研究対象の各システムでは、流体力学的直径はナノ粒子濃度によって変化せず、100μg/ mLのAuMt2s-DMEMの場合のみ、評価された最低濃度に対して粒子サイズが大きくなります。これは、これらの濃度でのNP凝集プロセスを示している可能性があります。 [32]。
フーリエ変換赤外分光法(FTIR)
図3に示すFTIRスペクトルは、Mt抽出物、AuMt1、およびAuMt2に対応します。 3250 cm -1 を中心とする特徴的な広帯域 主にタンニンとフラボノイドからのフェノール性OHに関連しています。 1594 cm -1 のピーク 1705 cm -1 でのN-H曲げ振動に対応 ケトン非環式ストレッチおよび1000〜1300 cm -1 の領域 C–Oストレッチに。 1600〜500 cm -1 の範囲のピーク ポリフェノールで識別され、1235および1160 cm -1 の信号 芳香族C–O結合の伸縮に関連しており、1020 cm -1 脂肪族C–Oバンド伸縮および1235 cm -1 特にエーテルの環状性の特徴と関係があります。これらのシグナルは、ミモザタンニン、フラボンサクラネチン、トリテルペノイドサポニン、カルコン、 N など、Mt抽出物に最も豊富に含まれる化合物に関連している可能性があります。 、 N -ジメチルトリプタミンアルカロイド(追加ファイル1:図S3)。サンプルAuMt1とAuMt2は、ポリフェノールの領域に同じ特徴的なピークを示し、NPがMt抽出物分子によって安定化されていることを確認しています[60]。 1331 cm -1 の変化が見られます 幅のバンドで、AuMt1とAuMt2のピーク強度の減少は、AuNPとポリフェノールのC-Hグループ間の結合に対応します。 1723 cm -1 Au 3+ の還元中に、ポリフェノールがカルボン酸化合物に酸化されることによりシフトします。 Au 0 へ [51、61、62]。
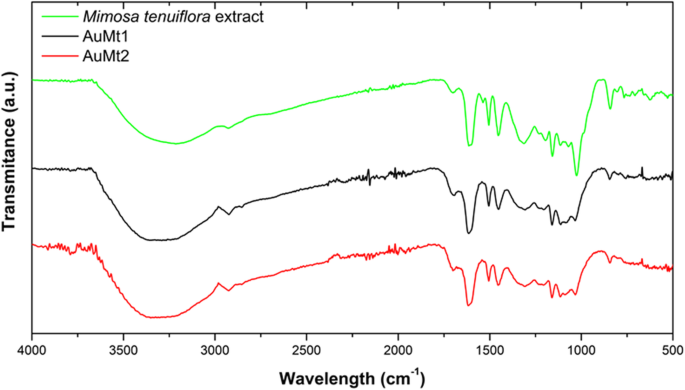
FTIRスペクトル。 Mt抽出物(緑)、AuMt1(黒)、AuMt2(赤)
X線光電子分光法(XPS)
AuMt1およびAuMt2のXPSサーベイスキャン分析では、サンプルは酸素(O 1 s )の存在を明確に示しています。 )、カーボン(C 1 s )とゴールド(Au 4 f )、図4a、bに示すように、ピークはそれぞれ532、284、85eVを中心にしています。高解像度XPS実験は、AuNP表面をコーティングする分子のさまざまな官能基の相対的な存在量を確立するために行われました。 Au4 f AuMt1とAuMt2の高分解能XPSスペクトルは、3.7 eVで分離された2つの対称ピークで構成されています(図4b、e)。 Peaks associated with 4f 5/2 spin-orbital coupling are located on binding energy (BE) of 88.6 and 87.7 eV for AuMt1 and AuMt2, respectively. For 4f 7/2, spin-orbital coupling peaks are located on 84.9 and 84.0 eV. The link of intensities (I4f 7/2 > I4f 5/2 ) and location and separation (ΔBE = 3.7 eV) between peaks confirm that gold ions (Au 3+ ) are reduced completely to metallic gold Au 0 [63]. Au4f signals, for AuMt1, are slightly shifted (~ 0.9 eV) at higher energies with respect to sample AuMt2. This can be explained in terms of NP size differences between samples. AuMt1 has a half population of NPs with size less to 40 nm, while AuMt2 NPs have a mean diameter of 150 nm, determined by TEM. Peak shift for Au4f signals, due to the presence of small NPs, has been reported by other authors who relate the Au4f BE increase with decreasing NP size [64, 65]. Also, the shift effect could be due to the interaction of functional groups capped on surfaces of AuNPs [66]. In Fig. 4c, f, the high-resolution XPS spectra of C1s are shown for AuMt1 and AuMt2. Spectra were deconvoluted by 3 Gaussian bands associated with C=O, C–O, and C–C or C=C. For AuMt1, peaks are centered on 286.9, 286.1, and 284.5 eV, for AuMt2 on 287.0, 286.3, and 284.7 eV, respectively. Comparing the experimental XPS curves for C 1s , we see appreciable differences between AuMt1 and AuMt2. The main difference comes from a significant decrease in AuMt1 of the signal associated with C–O group. Comparing the percentage contributions of each group, obtained from the deconvolutions (Additional file 1:Table S2), we see that in AuMt2 contribution of C–O signal is 27.8% while in AuMt1 is 16.6%. This difference can be explained in terms of the oxide-reduction reaction that gives rise to the process of AuNP formation. The synthesis of AuMt1 is added twice the metal precursor (HAuCl4 is 0.01 M) than in synthesis of AuMt2. In both cases, the same amount of extract is used as a reducing agent, so in AuMt1, more hydroxyl groups (−C–OH) are consumed to reduce a greater number of Au 3+ イオン。 Thus, a decrease of C–O signal in AuMt1 confirms that hydroxyl groups participate in the synthesis reaction. High-resolution XPS of O 1s revealed that carbonyl C=O is the most abundant group (Additional file 1:Figure S4 and Table S2). In addition, the content of the C=O group is higher in the AuMt1 sample, which confirms what was previously discussed.

XPS spectra of AuMt1 and AuMt2. a 、 d Survey spectra, b 、 e Au4f high resolution, and c 、 f C1s high resolution
XPS and FTIR indicate that AuMtNPs interact mainly with carbonyl groups (ketones) in addition to hydroxyl groups of Mimosa tannins, saponins, and other molecules that participate in the reduction of Au 3+ Au 0 へ and stabilization of AuMtNPs [63, 67, 68].
Transmission Electron Microscopy
AuMt1 TEM micrographs are shown in Fig. 5a, b and AuMt2 in Fig. 5d, e showing products’ shape distribution. AuMt1 has the biggest diversity in shapes. AuMt shape is determined by the relationship between the variation of metal precursor concentration and Mt extract at a fixed concentration. In this case, NPs were observed without cleaning the extract to observe the interaction that forms around the AuMt. As observed in the micrographs, an extract is placed on the surface; however, NPs are kept dispersed and no aggregation is shown. Figure 5c, f show size distribution for each sample, and AuMt1 have an average size dispersion of 40 nm and AuMt2 of 150 nm.

Size distributions by TEM. a 、 b 、 c AuMt1 and d 、 e 、 f AuMt2
In Fig. 6a, AuMt TEM micrographs were also analyzed by EDS (Fig. 6b), which showed Au presence. Other chemical elements such as Cl, O, and Ca, on EDS spectrum, come from the extract that surrounds NPs. According to the crystallographic tab (JCPDS file:04-0784), the obtained distances between 2.35 and 2.03 Å (Fig. 6c) correspond to Au crystalline planes (111) and (200).

Nanostructural characterization of AuMt. a TEM, b EDS, c single HRTEM, and FFT and d XRD
X-ray Diffraction (XRD)
Figure 6d shows the characteristic AuMt XRD diffraction peak at 2Ɵ , which are in 38.17, 44.37, 64.81, and 77.66 o corresponding with the planes (111), (200), (220), and (311), respectively; these planes correspond with the face-centered cubic Au (space group Fm 3 m, JCPDS File No. 89-3722). High Score Plus and Origin software were used for the analysis [69].
Biological Tests
Cytotoxicity by MTT and Live/Dead Assay
To evaluate AuMt1 and AuMt2 toxicity, tests were performed on HUVEC cells using MTT. Four concentrations and two times for both materials were evaluated. In Fig. 7a, it is observed that at 24 h for AuMt1, cell viability decreases between 10 and 20%, only in concentrations higher than 25 μg/mL. For AuMt2, a similar effect is obtained in cell viability; however, the concentration of 100 μg/mL seems to have no effect on these tests. In Fig. 7b, MTT tests at 48 h for AuMt1 and AuMt2 are shown. For AuMt1, it is easy to notice that concentration with the greatest effect is 50 μg/mL, where the viability drops almost 30% compared to the control. The concentration of 50 μg/mL seems to be the concentration with the highest toxic effect; however, when the obtained data were analyzed, it is found that there is no significant difference between the obtained data on 24 and 48 h, a similar result obtained for 100 and 200 μg/mL, Fig. 7c. For AuMt2, a toxic effect between 20 and 30% is observed only on 100 and 200 μg/mL, while 25 and 50 μg/mL show no significant difference, compared to the observed effect at 24 h, Fig. 7d. This seems to correlate with AuMt2 size growth in s-DMEM (Additional file 1:Figure S2) where at a concentration of 100 μg/mL, they begin to aggregate. In the work published by Chandran et al. [70], they used gold nanoparticles coated with branched polyethyleneimine (BPEI), lipoic acid (LA), and polyethylene glycol (PEG), where they see an important toxicity in HUVEC cells by nanoparticles coated with BPEI, which have sizes of 40 and 80 nm, where viability is between 20 and 30%. When these particles are covered with human serum proteins, it is found that toxicity decreases; this is due to the corona effect. Recently, Zhaleh et al. [71] have reported the biogenic synthesis of 40-nm gold nanoparticles using leaf extracts from Gundelia tournefortii L. 植物。 Interestingly and in contrast to our results, the authors indicate that MTT cell viability tests for these particles in HUVEC, the cell viability was 95% at 1000 μg/mL; however, they do not establish if the low cytotoxicity is due to the fact that there is no material internalization or if the particles are harmless due to protein corona. In this sense, bioreductive compounds present in Gundelia tournefortii L extract are different from those reported for Mimosa tenuiflora extract (Additional file 1:Figure S3). Thus, the interactions of these two nanoparticle systems with proteins present in FBS are very different, which may explain the differences in cytotoxic responses.

Viability assay using MTT in HUVEC cell. a For 24 h and b 48 h. 0ne-way ANOVA analysis with (*p <0.05)。 Comparison between 24 and 48 h for c AuMt1 and d AuMt2 with ANOVA analysis with Tukey tests (n.s. no significance and (*p < 0.05))
As mentioned above, AuMt1at a 50-μg/mL concentration shows the highest toxicity and cellular uptake. We believe that toxicity may be due to the fact that the nanomaterial has a low affinity to s-DMEM proteins, since it has only 16.6% of hydroxyl groups on the surface to promote hydrogen bonding with S-DMEM proteins. The fact that the material toxicity decreases as AuMt1 concentration increases may be due to a cellular detoxification response, like an exocytosis caused by high intracellular content of gold [70]. For AuMt2, the toxicity effect at 100 and 200 μg/mL may be due to nanomaterial agglomeration, which could be attaching to the membrane causing adverse effects for the cells; however, more experiments are required to confirm this hypothesis.
Only one concentration (50 μg/mL) was chosen to be evaluated by live/dead fluorescent dye; this is due to the purpose of confirming the MTT results and later analyzing the metallic NP internalization in HUVEC cells, avoiding a field saturation by NPs. When cells were stained with live/dead fluorescent dye kit, it was found that a large part of the cell population favorably marked for calcein and just a few for ethidium homodimer, indicating that cell culture is viable, as shown in Fig. 8.

Live/dead assay in HUVEC cells. a 、 d 、および g with calcein; b 、 e 、および h with ethidium homodimer;および c 、 f 、および i merge by confocal microscopy
Confocal Laser Scanning Microscopy:Fluorescence of AuMt
In Fig. 9a, d are shown micrographs of AuMt1 and AuMt2 in bright field and in Fig. 9b, e, their corresponding fluorescence, captured by confocal microscopy. Red fluorescence of AuMt (collected emission 650–700 nm) was excited employing 640 nm diode laser, and a mayor size of NPs can be appreciated in AuMt2 sample than AuMt1. In the merge images in Fig. 9c, f, it can be observed how the luminescence comes exclusively from the dark points associated with the NPs. This indicates that the cleaning process effectively removed the extract that is not complexed to the nanomaterial, so there is no background emission. It is interesting to observe that an intense fluorescence of the NPs captured by the confocal system is achieved at a very low excitation power of the laser (below 0.5 mW). So, this NPs system can be fluorescently traced efficiently in cellular systems with little risk of phototoxicity. Some authors have reported fluorescent emission about 610 nm, suggesting intrinsic Au fluorescence [72, 73]. AuNPs emission is related to the core size confinement effect that generates discreet electronic states [74]. However, in our case, the metal surface is covered with flavonoids, which show fluorescence, and when complexing with AuNPs, the fluorescence of both is enhanced. Different authors have reported that fluorescence is largely enhanced by charge transfer from the surface ligands to the metal core via S–Au bonds [75]. It has also been reported that ligands (thiol molecules, DNA oligonucleotides, dendrimers, polymers, peptides, and proteins) affect AuNPs optical and electronic properties since its fluorescent properties can be significantly affected by their surface chemistry [76].

AuMt1 and AuMt2 fluorescence. a 、 d Bright field. b 、 e Confocal. c 、 f Merge
Cellular Internalization
Cells were also analyzed, by confocal microscopy, after 24 h incubation, with AuMt1 and AuMt2 at a concentration of 50 μg/mL. The nucleus is shown in blue color using DAPI Fig. 10a, and the cytoskeleton structure was stained with anti-beta actin in green color Fig. 10b and merge Fig. 10c. The observed micrographs were obtained through 3 different channels on separate tracks, where the excitation wavelengths were 405, 488, and 640 nm for DAPI, anti-beta actin, and AuMt, respectively.

AuMt1 and AuMt2 cellular internalization. a 、 d 、および g with DAPI; b 、 e 、および h with beta-actin;および c 、 f 、および i merge by confocal microscopy
As previously described, cells were also analyzed by confocal microscopy, for AuMt1 and AuMt2 internalization, at a concentration of 50 μg/mL. Confocal micrographs show that AuMt are internalized in HUVEC cells cytosolic space, and many of these particles are surrounding the nucleus, without being internalized in it. When not observing particles in the nucleus, a more meticulous analysis was carried out, by cell orthogonal projection and a 3-D reconstruction. Observing the micrographs of both reconstructions, it is possible to notice that AuMt is distributed differentially. In Fig. 11a, b for AuMt1, it can be observed that a material is dispersed in the cytoplasm, while in AuMt2, the material is concentrated in the nuclear periphery, as shown in Fig. 11c, d. We were not able to find NPs in the nucleus, and this suggests that the nanomaterial has little or no genotoxic potential, since it has no way of interacting with nuclear DNA, which is a quality for a nanocarrier. Efficient cellular uptake depends on NP size, shape, charge, and coating, the parameters that can affect their interactions with cell proteins. The fact that polyphenolic compounds are found on AuMt surface could facilitate the nanomaterial internalization, which would make it a candidate as a possible pharmacological nanocarrier [77,78,79].

Orthogonal projections and 3-D images. a 、 c AuMt1 and AuMt2 cellular internalization analysis through orthogonal projection and b 、 d 3-D reconstruction by confocal microscopy
The obtained results for an AuMtNP cellular uptake in HUVEC by a confocal microscopy at 50 μg/mL suggests that AuMt1 interacts with the cells in a greater quantity than AuMt2 in a 3:1 ratio, as seen in Additional file 1:Figures S5–S7. If we consider that protein corona in AuMt1 is 9.1 nm smaller than in AuMt2, we can suggest that AuMt1-efficient internalization by HUVEC cells is given by a combination of factors such as AuMt1 smaller size, the highest absolute value of z potential and the lower thickness of protein corona. This indicates a poor protein coverage that allows partial exposure of the nanoparticle surface, which is rich in extract molecules. Therefore, nanoparticles can interact by means of extract molecules with surface-specific membrane receptors that facilitate the internalization of AuMt1.
Catalytic Tests
Catalysis
Analysis of catalytic reaction was realized to calculate the degradation percentage ( %D) using the Eq. (5):
$$ \%D=\frac{\left({A}_0-A\right)}{A_0}x100 $$ (5)using the A 0 absorbance at t = 0 and A is the absorbance at time t 。 Langmuir-Hinshelwood equation was used to calculate the slope of the regression plot \( \ln \left(\frac{A}{A_0}\right) \) versus irradiation time [80], which is expressed in Eq. (6) and K is the first-order rate constant of the degradation ratio:
$$ \ln \left(\frac{A}{A_0}\right)=Kt $$ (6)For the analysis of catalytic activity on MB degradation, the absorbance at 660 nm was monitored. Figure 12 shows the AuMt1 and AuMt2 catalytic activity, where a decrease on maximum absorption of MB is observed as time progresses Fig. 12a, d. MB degradation and its conversion to leucomethylene is confirmed by progressive decreases of the absorbance at 292, 614, and 660 nm correspond to MB and by the increase in time of the absorbance at 256 nm associated with leucomethylene. Homogeneous catalysis reaches a 50% MB degradation at 190 s Fig. 12b, while the degradation ratio K for the total process is 8.24 × 10 −3 s to AuMt1 Fig. 11c. AuMt2 reaches a 50% of MB degradation in 400 s, Fig. 12e, and K takes the value of 3.54 × 10 −3 /s, Fig. 12f.

AuMt1 and AuMt2 Catalysis. a 、 d UV-Vis spectra. b 、 e Percentage. c 、 f Ratio of MB degradation
On this way, AuMt1 have a more efficient response than AuMt2. We observed a size-dependent effect (AuMt) in degradation ratio [81], and a total surface area of NPs is inversely proportional to the NP size [37]. Table 2 shows a comparison between different green syntheses of AuNPs and their K obtained in size function.
<図>Conclusions
In this work, we show for the first time that the extracts of bark of Mimosa tenuiflora allow the production at room temperature of gold nanoparticles by means of one-pot synthesis. AuNP sizes are easily controlled by regulating a metal precursor/reducing an extract ratio. It was observed that AuMt1 and AuMt2 cellular uptakes generate a moderate cytotoxic effect at 24 and 48 h post exposition. However, toxicity does not behave in a dose-dependent manner, which suggests different action mechanisms for AuMt1 and AuMt2. XPS and FTIR indicate that AuMtNPs interact mainly with carbonyl groups (ketones) in addition to hydroxyl groups of Mimosa tannins, saponins, and other molecules that participate in the reduction of Au 3+ Au 0 へ and stabilization of nanomaterials. Polyphenols adsorbed on AuMtNPs facilitate nanoparticle internalization. AuMt2 were located near the nuclear periphery, but for AuMt1, it was observed that nanoparticles distribute on the whole cell and present a 3 fold uptake in comparison to AuMt2. Due to the fluorescence property at low excitation power and a high cellular uptake, AuMtNPs synthesized with Mt bark extracts are candidates for its implementation as drug nanocarriers and fluorescent probes in cells. However, other strategies must be addressed, in order to reduce the nanomaterial toxicity. Finally, it was observed that AuMtNPs showed a relevant catalytic activity on MB degradation using NaBH4 as a reducing agent.
データと資料の可用性
All datasets are presented in the main paper.
略語
- ANOVA:
-
Analysis of variance
- AuMt:
-
Colloids formed by AuNPs and molecules of Mt
- AuNPs:
-
金ナノ粒子
- CLSM:
-
共焦点レーザー走査顕微鏡
- DLS:
-
動的光散乱
- DMEM:
-
Dulbecco’s modified Eagle medium
- DMSO:
-
ジメチルスルホキシド
- DPPH:
-
2,2-Diphenyl-1-picrylhydrazyl
- EDS:
-
Energy dispersive X-rays spectroscopy
- FTIR:
-
フーリエ変換赤外分光法
- HAuCl 4 :
-
Tetracloroauric acid
- HRTEM:
-
High-resolution TEM
- HUVEC:
-
Human umbilical vein endothelial cells
- MB:
-
Methylene blue
- Mt:
-
Mimosa tenuiflora
- MTT:
-
3-(4,5-Dimethylthiazolyl-2)-2,5-diphenyltetrazolium bromide
- NaBH4 :
-
Sodium borohydride
- PBS:
-
リン酸緩衝生理食塩水
- PdI:
-
多分散度指数
- PMT:
-
Photomultiplier tube
- ROI:
-
Region of interest
- SD:
-
Standard deviations
- SPR:
-
表面プラズモン共鳴
- TEM:
-
透過型電子顕微鏡
- UV-Vis:
-
紫外可視
- XPS:
-
X線光電子分光法
- XRD:
-
X線回折
ナノマテリアル
- プラズモンナノ粒子
- 化学療法センサー用の金ナノ粒子
- 改善された診断および治療用途のための多機能金ナノ粒子:レビュー
- 小さなセレンナノ結晶とナノロッドの容易な合成と光学的性質
- CuSナノ粒子でコーティングされた着色および導電性CuSCN複合材料の容易な合成
- HT29およびSPEV細胞株に対するAuナノ粒子の影響のinvitro研究
- 水溶性α-NaGdF4/β-NaYF4:Yb、Erコアシェルナノ粒子の合成と発光特性
- 細胞内タンパク質送達のためのシリカナノ粒子:緑色蛍光タンパク質を使用した新しい合成アプローチ
- 1D混合二元酸化物CeO2-LaOx担持金触媒の合成とCO酸化活性
- 銅ナノ粒子の合成と安定化におけるグリーン熟達度:触媒、抗菌、細胞毒性、および抗酸化活性
- 音響浮揚を使用したPtナノ結晶およびPt /ミクロポーラスLa2O3材料の高速合成