


蛍光X線分析による分析
X線蛍光分光法による分析
蛍光X線(XRF)は、元素の同定と測定の分野で幅広い用途が見出されている発光分光技術です。この手法は、電子ビーム、荷電粒子ビーム、またはxなどの外部エネルギー源による原子電子エネルギーレベルの励起に続く、通常1keVから60keVのエネルギー範囲での特徴的なX線の放出に依存します。 -光線ビーム。ほとんどのサンプルマトリックスでは、X線分析により1マイクログラム/ gサンプル(1 ppm)未満の濃度の元素を検出できます。薄膜サンプルでは、1マイクログラムの10分の数の合計量を検出できます。当初、X線分光法は、冶金および地球化学分析に関連するアプリケーションで広く受け入れられていました。最近では、X線分光法は、環境サンプルの分析、石油製品中の硫黄および摩耗元素の測定、法医学サンプルを含むアプリケーション、および電子およびコンピューター関連材料の測定に役立つことが証明されています。
>蛍光X線(XRF)分光分析は、多くの分析問題において用途の広いツールです。主要元素、微量元素、微量元素は、金属、合金、ガラス、セメント、鉱物、岩石、鉱石、ポリマー、環境および生物学的材料など、さまざまな種類のサンプルで定性的および定量的に測定できます。ナトリウム(Na)からウラン(U)までの元素は、エネルギー分散型蛍光X線(EDXRF)分光計を使用して日常的に測定されますが、波長分散型蛍光X線(WDXRF)分光計を適用すると、低Z元素の効率的な測定が可能になります。ベリリウム(Be)ですら。サンプルは処理せずに分析できますが、適切なサンプル準備を適用すれば、高品質の結果を保証できます。これは、サンプル(金属、合金)の単純な洗浄と研磨、バインダー(セラミック、鉱物、鉱石、土壌など)の有無にかかわらず粉末化とペレット化、サンプルを適切なフラックス(セラミック、岩石、鉱石、など)酸(金属、合金)で消化します。このようにして、表面粗さ、粒子サイズの影響、または材料の不均一性に起因するエラーを排除または最小限に抑えることができます。
レントゲンは1895年にX線を発見しました。H.G.J。 Moseleyは、原子構造とX線放射の関係を開発し、1913年に、最新のX線分光法の基礎となる最初のX線スペクトルを公開しました。 Moseleyは、X線技術を使用した定量的な元素測定の可能性を認識しました。今日知られているX線分光計につながるルーチンのX線計装の開発は、その後の数十年にわたって行われました。 Coolidgeは1913年に、現在使用されているものと同様のX線管を設計しました。ソレルは1924年にX線のコリメーションを達成しました。1928年のガイガーとミューラーによるガスX線検出器の改良により、1948年にフリードマンとバークスによる最初の商用WDXRFが設計されました。ゲルマニウムとリチウムをドープしたシリコン半導体検出器により、X線スペクトロメータの設計が変更されました。最新のエネルギー分散型機器は、さまざまなサンプルの元素の定性的な識別を容易にします。エネルギー分散型X線スペクトルの情報量は、1回の測定で無機材料から得られる最高の情報量の1つです。スペクトルピークの位置と強度は定性的および定量的情報を提供し、バックグラウンドの強度はサンプルマトリックスのバルク組成に関する情報を提供します。
X線分光法は、さまざまな形態の固体サンプルに適用できる数少ない手法の1つです。 XRF分光計の大部分は実験室で使用されていますが、多くは生産および品質管理のための日常的な分析や特殊なタスクに応用されています。 EDXRF分光計の構造図を図1に示します。
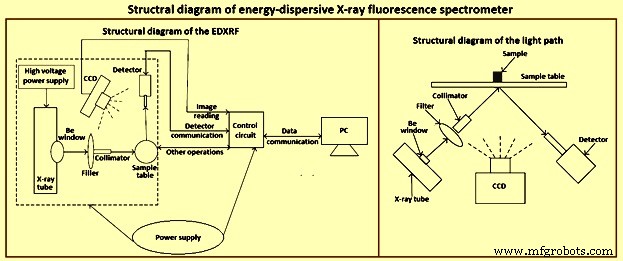
図1EDXRF分光計の構造図
電磁放射
電磁放射は、宇宙を伝播することができ、原子や分子と相互作用してそれらのエネルギー状態を変えることができるエネルギー形態です。両方の特性は分光法にとって重要です。電磁放射は、説明するために2つの理論を必要とする動作を示します。波動理論は、屈折、反射、回折、散乱などの電磁放射の振る舞いを説明します。放射は、それぞれが同じ周波数と波長を持つ2つの直交する波からなるエネルギー形態として定義されます。 1つは振動電場で、もう1つは振動磁場であるため、電磁放射という用語が生成されます。
真空中では、空間を通過する波の伝播速度は光速です(c =3×10の10乗/秒)。これは、方程式w.v=cで表される重要な基本的な関係につながります。この式は、電磁放射の波長(w)とその周波数(v)の積がその速度に等しいことを示しています。電磁放射の波長は、何桁にもわたって変化します。たとえば、通常のAM放送帯域の電波の波長は数百メートル、紫外線の波長は10nmから100nm(ナノメートル)の範囲です。対照的に、分光法で有用なX線は0.01nmから10nmの範囲です(図2)。
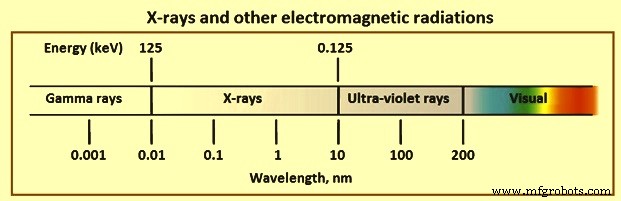
図2X線およびその他の電磁放射
波長分散型分光法の場合、波長単位を使用する方が便利な場合がよくありますが、エネルギー分散型X線分析(EDS)の場合は、エネルギー記述の方が便利です。ただし、相互変換は簡単です。
X線の特性について通常使用されるいくつかの説明は重要です。電磁放射の強度の適切な意味は、単位時間あたりの単位面積あたりのエネルギーです。ただし、検出器からの単位時間あたりのカウント数は、強度として頻繁に使用されます。この領域は使用される検出器のアクティブ領域であり、時間は調整可能なパラメータであるため、カウントの使用はX線強度の実際的な説明です。硬X線または軟X線という用語は、それぞれ短波長(0.01nmから0.1nm)と長波長(0.1nmから1nm)のX線を区別するためによく使用されます。 X線は、電磁スペクトルの高エネルギー領域に分類されます。
X線放射
X線は、原子の電子軌道の乱れから生成されます。これはいくつかの方法で行うことができますが、最も一般的なのは、高エネルギー電子、X線、または加速された荷電粒子によるターゲット要素への衝撃です。最初の2つは、X線分光法で直接または間接的に頻繁に使用されます。電子衝撃は、X線エネルギーの連続とターゲット要素の放射線特性をもたらします。 X線分光法では両方のタイプの放射線に遭遇します。
連続 –エネルギーに対する強度の滑らかで連続的な機能を備えたX線の放出は、連続放射または制動放射と呼ばれます。 X線連続体はいくつかの方法で生成できます。ただし、最も有用なのは、X線管内のターゲットに衝撃を与えるために使用される電子ビームです。連続体は、さまざまなエネルギーの軌道電子の分布である、ターゲットに衝突する高エネルギー電子の漸進的な減速の結果として生成されます。衝突する電子が束縛された軌道電子と相互作用すると、それらの運動エネルギーの一部が放射線に変換されます。変換される量は、関与する電子の結合エネルギーに依存します。したがって、各相互作用で変換されるエネルギー量については、ある程度統計的な確率が存在します。
衝突電子が標的元素の軌道電子と相互作用する確率は、元素の原子番号とともに増加します。したがって、連続放出の強度は、標的元素の原子番号とともに増加します。さらに、相互作用の確率は、ビームまたはフラックス内の単位時間あたりの電子の数とともに増加します。したがって、連続体の強度は、ミリアンペアで表される電子ビーム電流とともに増加します。さらに、衝突する電子がターゲット要素の緊密に結合した電子と相互作用する能力は、衝突する電子の運動エネルギーとともに増加します。ビーム内の電子の運動エネルギーは加速ポテンシャルとともに増加するため、連続体の積分強度は電子加速ポテンシャルとともに増加し、キロボルトで表されます。最後に、X線光子として現れる最大エネルギーは、衝突する電子の運動エネルギーに等しく、これは加速ポテンシャルに関係します。連続体の最大強度のエネルギーは、最大放出エネルギーの約3分の2にあります。さらに、ターゲット材料内でのX線の吸収、またはX線管と検出器の窓に使用される材料による吸収があります。したがって、特に低X線エネルギーでは、強度分布に何らかの変更が生じる可能性があります。
特徴的な放出 –ターゲットに衝突する電子のほとんどは、非特異的な相互作用でターゲット要素の軌道電子と相互作用し、内部軌道電子の乱れをほとんどまたはまったく発生させません。ただし、一部の相互作用により、これらの軌道から電子が放出されます。結果として生じる空孔、または穴は、高エネルギーの不安定な状態を表します。軌道空孔が最も内側のシェルにある場合、外側のシェルからの電子がカスケードしてそれらを埋めます。これにより、エネルギーが低くなり、状態がより安定します。プロセスによって放出されるエネルギーは、X線として現れる可能性があります。発生する可能性のある各遷移は、ターゲット要素に特徴的な鋭いX線線の放出と関連する遷移につながります。これらの特徴的な放射線は、連続体とともに放出されます。
X線吸収
サンプルに衝突するX線は、サンプルの要素と2つの重要な相互作用を受けます。吸収と散乱です。放射線の吸収は、X線分光法のサンプル励起でかなりの特定の相互作用によって、またはサンプルから放出されるX線強度に影響を与えるより一般的な相互作用によって発生する可能性があります。 X線の散乱は、観測されたスペクトルのバックグラウンド強度につながります。
大量吸収 – X線ビームが材料を通過するとき、光子(電磁場)は非特異的な方法でターゲット要素の軌道内の電子と相互作用し、X線ビームの強度を低下させる可能性があります。相互作用は、電子の光電放出またはX線ビームの散乱につながる可能性があります。いずれの場合も、全体的な結果は、吸収材料の経路長に伴う強度の指数関数的な減少という観点から説明されることがよくあります。質量吸収係数は、指定されたX線エネルギーでの特定の元素の特性です。その値は、X線の波長とターゲット元素の原子番号によって異なります。
光電効果は、X線が物質を通過するときにX線を吸収するプロセスの中で最も重要です。光電効果は、X線ターゲットの元素の軌道からの電子の放出です。このプロセスは、X線の吸収に大きく寄与することが多く、サンプル中の元素から放出されるX線スペクトルの励起モードです。主に光電プロセスの結果として、質量吸収係数は、入射X線のエネルギーの増加とともに着実に減少します。特定の元素の吸収対エネルギー曲線には、鋭い不連続性があります。これらは、光電プロセスが特に効率的である特徴的なエネルギーに起因します。
散乱 – X線光子が原子の集まりに衝突すると、図3に示すように、光子がターゲット元素の電子と相互作用して、X線光子が散乱する可能性があります。サンプルからのX線の散乱は次のとおりです。 X線分光法で得られたスペクトルのバックグラウンド信号の主な原因。 X線の散乱は、主に元素の外側の弱く保持された電子によって引き起こされます。衝突が弾性である場合、散乱はエネルギーを失うことなく発生し、レイリー散乱として知られています。非弾性の場合、X線光子はエネルギーを失って電子の放出を引き起こし、散乱はインコヒーレントになります。 X線光子の経路は偏向され、光子はエネルギー損失またはより長い波長を持ちます。これはコンプトン散乱です。
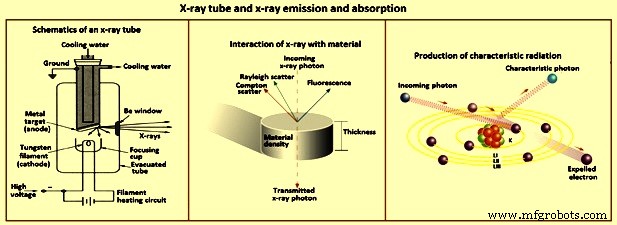
図3X線管とX線の放出と吸収
散乱は2つの方法でX線分光分析に影響を与えます。まず、電子の数が多いため、散乱放射線の総量は原子番号とともに増加します。ただし、原子番号のマトリックスが低いサンプルでは、サンプルによる自己吸収が減少するため、観測される散乱が大きくなります。次に、サンプルマトリックスの原子番号が減少するにつれて、「コンプトン対レイリー」散乱強度の比率が増加します。コンプトン散乱に関連するエネルギー損失により、放射の波長に予測可能な変化が生じます。
元素とX線の関係
元素とX線のさまざまな関係を図4に示します。
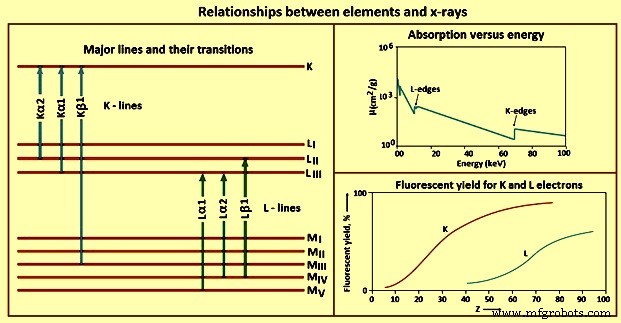
図4要素とX線の関係
吸収 – X線光子は、吸収または散乱される元素の軌道電子と相互作用する可能性があります。 X線分光法の最適な操作条件を選択するには、吸収と元素の原子番号の関係が重要です。
質量吸収係数は、X線の特定のエネルギーおよびX線の各エネルギーで、各元素または物質の特定の元素または物質で異なります。軌道電子との相互作用の可能性が高いため、質量吸収係数は、ターゲット材料の元素の原子番号とともに増加します。与えられた原子番号で、質量吸収係数はX線放射の波長とともに減少します。これらは、原子のさまざまな軌道からの電子の光電放出に必要な特定のエネルギーに起因し、元素の特徴です。
吸収エッジは、入射X線の波長またはエネルギーに対する質量吸収のプロットの不連続点または臨界点です。吸収端エネルギーは、元素の軌道から電子を光放出する正確な量です。主量子数が低いほど、そのシェルから電子を放出するために注意するエネルギーが高くなります。 L電子を放出できるX線の波長は、Kシェルから電子を放出するのに必要な波長よりも長くなります(エネルギーが少なくなります)。つまり、K吸収端エネルギーは、特定の元素のL吸収端エネルギーよりも大きくなります。
排出量 –光電効果は、原子の電子軌道に不安定な状態を作り出すX線吸収メカニズムです。内軌道に空孔が形成されると、励起された要素に特徴的なX線の放出によって、安定した基底状態への緩和が発生する可能性があります。 1 sのエネルギー 電子は価電子の状態から保護されているため、吸収端のエネルギーと放出されたX線のエネルギーは、原子の酸化状態と結合に本質的に依存しません。
Kライン –光電効果により、Kシェルに空孔が生成されると、励起状態は、空軌道からの電子で空孔を埋めることによって緩和されます。選択規則と呼ばれる量子力学的規則のため、特定の遷移のみが許可されます。選択規則に従う遷移は許可(図)線と呼ばれ、禁止されていない遷移は禁止と呼ばれ、放出時に内部軌道に2つ以上の空孔を持つ原子をもたらす遷移は衛星(非図)と呼ばれます。 )行。 K線の数、および元素について観察された正確な数は、満たされた軌道の数に部分的に依存します。
Lライン –ほとんどのWDXRFX線スペクトロメータの実用的なエネルギー範囲は0keV〜100 keVであり、EDXRFスペクトロメータでは0 keV〜40 keVであるため、K線以外の輝線の使用を検討する必要があります。与えられた元素に対して、L線はK線よりも低いX線エネルギーで励起されます。 L線の使用は、原子番号が約45を超える元素に特に役立ちます。
Mライン –mラインは、ルーチンのX線分光法での用途が限られています。原子番号が約57未満の元素では線が観察されず、観察すると遷移エネルギーが低くなります。これらのラインの唯一の実用的な用途は、トリウム、プロトアクチニウム、ウランなどの元素です。これらは、サンプル内の他の元素のL線との干渉を避けるためにこれらの場合にのみ使用されます。
蛍光収量 –電子は、光電プロセスによって原子軌道から放出され、X線光子放出または2次(オージェ)電子放出の2つの結果が考えられます。これらのイベントの1つは、励起された原子ごとに発生しますが、両方では発生しません。したがって、二次電子の生成は、サンプル内の励起された原子からのX線光子放出と競合します。 X線を放出する励起された原子の割合は、蛍光収量と呼ばれます。この値は、検討中の要素とX線ラインのプロパティです。原子番号の低い元素は、蛍光収率も低くなります。低エネルギーX線が示す高い質量吸収係数と相まって、X線分光法による低原子番号元素の検出と決定は困難です。
要素間効果 – X線分光法の遷移の場合、元素の特定の系列(K、L、M)の輝線は、その系列の吸収端以上のエネルギーを持ちません。重要な結果は、元素から放出されたX線は、その元素の他の原子の同じ軌道から電子を光放出できないということです。ただし、要素の混合で構成されるサンプルは、要素間効果と呼ばれることが多い相互作用を示す可能性があります。サンプル内の要素のこのような相互作用には、特別なデータ分析が必要になることがよくあります。
WDXRFスペクトロメータ
1950年代に商業的に導入されたX線分光計装は、波長分散型として知られており、サンプルから放出された放射線がソレルコリメータを使用してコリメートされ、分析結晶に衝突することを示しています。結晶は、ブラッグの法則に従って、X線の波長またはエネルギーに応じて、さまざまな程度に放射線を回折します。この放射線の角度分散により、サンプル内の元素から放出されるX線を順次または同時に検出できます。
同時計測器には通常、分析用結晶と検出器のセットがいくつか含まれています。 1つは、サンプル内の目的の分析物ごとに調整されます。これらの機器は高価ですが、事前に選択された元素の日常的な測定には効率的ですが、設置時に選択された元素以外の元素を測定するために簡単に変換することはできません。
より一般的なのは、サンプル、分析結晶、および検出器の間で角度を変化させるゴニオメーターと呼ばれる機械システムを含むシーケンシャル機器です。このようにして、ゴニオメータの動きによって、X線の所望の波長を選択することができます。シーケンシャルWDXRF分光計は、多くの元素を自動測定するためにコンピューター制御することができます。自動化されたWDXRF分光計の定量的アプリケーションは、機器が目的の決定のために正しい角度に進むようにプログラムできるため、効率的です。ただし、スペクトルはゆっくりとスキャンされるため、定性的なアプリケーションは効率が低くなります。
X線管 –さまざまなエネルギー源を使用して、X線放射を生成する元素の原子に励起された電子状態を作成できます。これらの中には、電子ビーム、荷電粒子ビーム、およびX線があります。電子ビームは、走査型電子顕微鏡(SEM)や電子マイクロプローブ分析などの手法でサンプルに向けられます。ただし、電子ビームを使用するには、電子のエネルギー損失を回避するために高真空が必要です。 X線分光法は、特殊なツールとしてではなく、用途の広い分析ツールとして最適に使用されます。多くのサンプルは高真空に適していないか、非導体であるため、電子ビームの下で充電の問題が発生します。したがって、このエネルギー源はX線分光法には実用的ではありません。
X線を放出する放射性同位体は、原子を励起してX線を放出するもう1つの可能性です。しかし、実験室で安全に取り扱うことができる同位体源からのX線束は、実際の使用には弱すぎます。これらの線源は通常、数本の細いX線線しか放射しないため、多くの元素を効率的に励起するにはいくつかの線が必要です。 X線分光法の最も実用的なエネルギー源はX線管です(図3)。
WDXRF分光計は、良好に機能するために効率的な高出力励起を必要とします。したがって、X線管の安定性と信頼性が重要です。すべてのコンポーネントは高真空になっています。フィラメントは、6 V〜14Vのフィラメント電圧で加熱されます。加熱されたフィラメントは熱的に電子を放出します。フィラメントとターゲットアノードの間を流れる電子のフラックスは、高度に制御および制御されます。この電子の流れは電流であり、通常はミリアンペアで測定されます。管電流はしばしばmAと呼ばれます。
フィラメント(陰極)とターゲット陽極の間に数キロボルトの電位が印加され、電子の加速電位として機能します。この電圧は通常、キロボルトで測定されます。アノードは通常銅であり、ターゲット表面はロジウム、銀、クロム、モリブデン、またはタングステンなどの元素の高純度の堆積物でメッキされています。 WDXRFスペクトロメトリーに使用されるX線管は2kWから3kWで動作します。この電力の多くは熱として放散され、X線管の水冷のための準備が必要です。これらのX線管用の電源と関連する電子機器は大きいです。電子は、印加された管電位に相当する最大運動エネルギーでターゲットに衝突します。電子の運動エネルギーが、ターゲット材料の原子からの内部軌道電子の放出に対応する吸収端エネルギーを超える場合、チューブはターゲット元素に特徴的なX線線を放出します。ビーム内の電子とターゲット元素の電子との相互作用も、連続体の放出につながります。連続体の面積と最大強度の波長は、電位、電流、およびアノードの組成によって異なります。
結晶の分析 –X線管から放出されたX線はサンプルに向けられます。ほとんどのX線分光計では、サンプルは逆光学として知られているX線管の上に配置されます。これにより、上面ではなく下面を使用して液体の表面を配置しやすくなります。サンプルから放出されたX線はコリメートされ、分析用結晶の表面に衝突し、分析結晶が放射線を分散させます。サンプルからの多色X線の平行ビームは、結晶内のさまざまな格子面から回折されます。異なる格子面からの回折によって放射が移動する追加の距離が波長の整数倍に等しい場合、補強が発生します。そうでない場合は、破壊的な干渉が発生します。ブラッグの法則により、分析結晶用に波長を選択する角度を計算できます。
検出器 – WDXRF分光計の検出器および関連する電子機器は、分析結晶から回折されたX線を検出し、分析結晶または検出器ノイズによる高次または低次の回折などの不要な信号を拒否します。通常、2つの検出器がタンデムに配置されます。 1つ目は、ガス充填または流動ガス比例計数管です。これらの検出器は、ハウジングから絶縁されたワイヤで構成されています。ハウジングの前面と背面にある薄いポリマー窓により、X線の出入りが可能になります。ワイヤーとハウジングの間に数百ボルトのバイアス電位が印加されます。
多くのガスを使用できますが、一般的なガスはP-10で、90%のアルゴン(Ar)と10%のメタンの混合物です。 X線が検出器に入ると、アルゴンがイオン化されて多くのAr+-e-ペアが生成されます。陽極線は電子を収集し、ハウジングの陰極壁の電子はAr+イオンを中和します。結果は、検出器に入る各X線光子の電流パルスです。 P-10で満たされた比例検出器は、約8 keV未満のエネルギー(約0.15 nmより高い波長)のX線光子を検出するのに最も効率的です。よりエネルギーの高いX線は比例検出器を通過する傾向があります。
比例計数管の後ろに頻繁に配置される2番目の検出器は、通常、シンチレーション検出器です。この検出器は、タリウムをドープしたヨウ化ナトリウム結晶[NaI(Tl)]で構成されており、X線光子が当たると青色(410 nm)のバースト光を放出します。結晶は、光パルスを検出する光電子増倍管に取り付けられています。生成される光子の数は、入射するX線光子のエネルギーに比例します。電子処理後、シンチレーションバーストはX線光子エネルギーに比例した振幅の電圧パルスに変換されます。これらの2つの検出器は、独立してまたは同時に操作できます。同時動作では、検出器の動作電位と出力ゲインを調整して、特定のエネルギーのX線光子が両方の検出器から同じパルス高電圧を生成するようにします。どちらのタイプの検出器も、パルス間で回復するのに約1マイクロ秒必要です。一部のカウントは、約30,000/sを超える入射フォトンレートで失われる可能性があります。検出器からのX線パルスのパルス高さの識別は、分析結晶から回折された高次または低次のX線を拒否します。
操作の基本 –サンプルを検討し、分析対象物の元素を選択する場合、最初の決定は輝線を選択することです。特定の干渉がない場合は、通常、最もエネルギッシュなラインが使用されます。多くのWDXRF分光計はX線管の100kV電位で動作できるため、原子番号が約75未満の元素の場合、これは通常Kラインです。可能であれば、分析物元素に使用される線の吸収端のすぐ上のエネルギーで特徴的な線を放出するX線管が選択されます。そのような管が利用できない場合、励起は利用可能なX線管の連続体を使用して達成されます。
X線管の電位は、吸収端エネルギーの約1.5倍以上に設定する必要があります。検出器は、使用する波長領域に基づいて選択します。比例計数管は、約0.6 nmより長いX線、約0.2 nmより短い波長のシンチレーション検出器、および0.2nmから0.6nmの重複領域の両方に使用されます。所望の波長を検出できる分析結晶を選択する必要があります。パラメータの選択の大部分は、コンピュータ制御を介して実行されています。
エネルギー分散型X線分析装置
WDXRF X線分光計でのゴニオメーターの使用は、サンプル内のさまざまな要素から放出されるX線をコンポーネントに分解するという要件に基づいています。分散装置の使用は、このタスクを達成するために多くのタイプの分光法で一般的です。適切な解像度を達成できる場合は、機械部品のない機器が望ましいです。リチウムドリフトシリコン検出器の開発と1960年代半ばのX線検出への応用は、EDXRF分光法として知られるようになった分光分析の分野につながりました。
WDXRF分光計で使用されるX線管の定格は2kW〜3 kWで、水冷式です。 EDXRF分光計で使用されるものは、はるかに低い電力で動作し、通常は空冷式です。一般的な管の範囲は9W〜100 Wです。さまざまな陽極材料が利用可能であり、X線分光計の各メーカーは特別なX線管機能を提供しています。ただし、チューブ設計を何度も試行した後も、WDXRF分光計で使用されているものよりもはるかに小さいものの、ほとんどが従来の「サイドウィンドウ」設計のままです。チューブと関連する電源の設計における主な要因は、チューブと電圧の安定性です。
直接X線管励起の代わりに、二次ターゲット励起を使用することもできます。このモードでは、X線管を使用して二次ターゲットを照射します。二次ターゲットの特徴的なX線蛍光を使用して、サンプルのX線放射を励起します。二次ターゲットを使用すると効率が大幅に低下するため、直接励起に必要なワット数よりも高いワット数のX線管が必要です。
二次ターゲット励起は時々重要な利点を提供します。たとえば、鉄サンプル中のバナジウムとクロムの低濃度レベルを決定するために、これらの元素は、サンプル中の鉄を励起することなく、鉄の二次ターゲットで励起することができます。直接管励起では、これは困難です。広範囲の要素をカバーするには、いくつかの二次ターゲットが必要です。二次ターゲット励起の使用は、励起用の単色放射源としてサポートされています。この利点の重要性は、基本的なX線方程式から直接強度を計算するために使用される基本的なパラメータのコンピュータプログラムの多くが、単色の励起放射を必要とすることです。
実際には、二次ターゲット励起は理想的な単色光にのみ近づきます。適切な一次フィルターを使用した直接管励起は、二次ターゲット技術と比較した場合に良好に機能します。したがって、直接X線管励起は、エネルギー分散型分光分析(EDS)の最大数のアプリケーションにとって最も実用的です。 EDS技術の主な強みは、同時多元素分析機能にあります。 Although special cases occur in which selective excitation is desirable, this frequently can be accomplished with intelligent use of an appropriate x-ray tube and filter. Any fundamental design features which limit the simultaneous multi-element capability diminish the advantage of the EDXRF spectrometer.
Since direct x-ray tube excitation is the most common method used in EDS, there are factors which govern the selection of an x-ray tube. In wavelength-dispersive techniques, several x-ray tubes are normally available for the spectrometer. These can be changed for different applications. This is not normally the case with EDS-systems, since many WDXRF spectrometer has few if any choices of primary filters. In wavelength-dispersive techniques, it is customary to attempt to excite the desired element by the characteristic emission lines of the tube anode material, but the continuum is used more efficiently in EDXRF spectrometers. The use of EDXRF spectrometers has been enhanced by computer control of tube current and voltage and selection of the primary filter. Selection and efficient use of a single x-ray tube is important in the configuration of an EDXRF system.
Characteristic lines emitted by an x-ray tube have much larger intensity at their maxima than the continuous radiation emitted. These lines are to be used for excitation whenever possible. In addition, use of a primary filter between the x-ray tube and the sample can effectively approximate monochromatic radiation impinging on the sample from these characteristic lines. EDXRF spectrometers normally offer various x-ray tube anode materials. For selecting the x-ray tube anode material, the applications most likely to be encountered are to be considered.
The principal concern is to select an anode which has characteristic lines close to, but always higher, in energy than the absorption-edge energies to be encountered. None of the characteristic lines are to create spectral interference with elements to be determined. This includes consideration of such details as the Compton scatter peak for the characteristic lines. In addition, it is difficult to perform determinations of the element of the anode material. This is especially true with samples having low concentrations of that element.
Rhodium is a favourable tube anode material for general-purpose use. The characteristic lines of this element are efficient for the excitation of elements with absorption edges to around 15 keV. The excitation efficiency for the K lines of the transition elements is low. However, the continuum can be used efficiently in this region. Rhodium also has characteristic L lines at around 2.7 keV to 3.0 keV. These are efficient for the excitation of the K lines of low atomic number elements, such as aluminum, silicon, phosphorus, and sulphur. However, in these cases, a silver anode is preferable because of the Compton scatter radiation from the rhodium lines. The characteristic lines and the continuum from the x-ray tube can be used for excitation.
Although the elements of many samples can be excited effectively using a combination of the characteristic x-ray lines from the tube anode element and the continuum, more monochromatic radiation is sometimes desired. One such situation involves enhancing the use of fundamental-parameter computations which permit quantitative determination of elements without the need for several concentration standards. A more frequent situation is the need to reduce the background in the spectrum energy range to be used in the analysis. Use of primary filters placed between the x-ray tube and the sample can be effective in these cases and are normally incorporated under computer control in commercial spectrometers.
The object is to filter the primary radiation from the x-ray tube and selectively pass the characteristic lines of the anode element. This is accomplished using a filter made of the same element as the tube anode. Since x-rays of a given line (K, L, and so on) of an element are lower in energy than the absorption edge for that element, the photoelectric component of the mass absorption coefficient is small. Such a filter does not efficiently absorb the characteristic line emitted by the x-ray tube. The higher energy x-rays from the continuum are efficient for the photoelectric process in the filter and are highly attenuated by absorption. X-rays of lower energy than the filter material absorption edge are absorbed more efficiently as the energy decreases.
The result is x-radiation striking the sample with an intensity which is largely determined by the characteristic lines of the tube anode and that approximates monochromatic radiation. Increasing the thickness of the filter decreases the total intensity, with further gain in the monochromatic approximation.
Detectors – The selective determination of elements in a mixture using x-ray spectrometry depends upon resolving into separate components the spectral lines emitted by the different elements. This process needs an energy-sorting or wavelength-dispersing device. For the WDXRF spectrometer, this is accomplished by the analyzing crystal, which needs mechanical movement to select each desired wavelength according to Bragg’s law. Optionally, several fixed-crystal channels can be used for simultaneous measurement. In contrast, EDS is based on the ability of the detector to create signals proportional to the x-ray photon energy. Hence, mechanical devices, such as analyzing crystals, are not needed.
Several types of detectors have been used, including silicon, germanium, and mercuric iodide. The solid-state, lithium-drifted silicon detector [Si(Li)] was developed and applied to x-ray detection in the 1960s. By the early 1970s, this detector was firmly established in the field of x-ray spectrometry and was applied as an x-ray detection system for SEM and x-ray spectrometry. The Si(Li) detector provides excellent resolution. It can be considered as a layered structure. Under reversed bias of around 600 V, the active region acts as an insulator with an electric-field gradient throughout its volume.
When an x-ray photon enters the active region of the detector, photo ionization occurs with an electron-hole pair created for each 3.8 eV of photon energy. Ideally, the detector is to completely collect the charge created by each photon entry and result in a response for only that energy. Some background counts appear because of energy loss in the detector. Although these are kept to a minimum by engineering, incomplete charge collection in the detector contributes to background counts. From 1 keV to 20 keV, an important region in x-ray spectrometry, silicon detectors are efficient for conversion of x-ray photon energy into charge.
Analyzer systems – The x-ray spectrum of the sample is obtained by processing the energy distribution of x-ray photons which enter the detector. One x-ray photon entering the detector causes photo-ionization and produces a charge proportional to the photon energy. Several electrical sequences are to take place before this charge can be converted to a data point in the spectrum. A detailed knowledge of the electronics is not necessary, although an understanding of their functions is important. Upon entering the Si(Li) detector, an x-ray photon is converted into an electrical charge which is coupled to a field effect transistor (FET). The FET and the electronics comprising the preamplifier produce an output proportional to the energy of the x-ray photon. Using a pulsed optical preamplifier, this output is in the form of a step signal. Since photons vary in energy and number per unit time, the output signal, due to successive photons being emitted by a multi-element sample, resembles a staircase with various step heights and time spacing. When the output reaches a determined level, the detector and the FET circuitry reset to their starting level, and the process is repeated.
The preamplifier output is coupled to a pulse processor which amplifies and shapes the signal into a form acceptable for conversion to a digital form by an analog-to-digital converter (ADC). Amplification is necessary to match the analog signal to the full-scale range of the ADC. This process involves the energy calibration of the spectrometer. Drift in the gain and/or offset (zero) of the amplification results in errors in the energy assigned to the x-ray photons producing the signal. Hence, these calibrations are to be as stable as possible, and calibration is to be routinely checked.
The energy calibration is important for qualitative identification of the elements and for precise quantitative results when using spectrum-fitting programs. The amplifier provides gain and zero controls for calibrations. Normal operation in x-ray spectrometry is to set the time on the system clock to be used to acquire the spectrum. The processing of the pulses is not instantaneous. At high count rates, the time needed can become significant. When a pulse is detected and processing initiated, the clock is ‘stopped’ until the system is ready to process a new photon. The length of time the clock is off is called dead time; the time the clock is on is called live time. Their total is real time. The system monitors live time. If the spectrometer is operated with a 50 % dead time, the real time is twice the live time.
Processing of the pulse created by a photon is to be complete before another pulse occurs. A pulse pile-up rejector circuit blocks a pulse if it is received too soon. Once activated, the pulse pile-up rejector prevents the new signal from being processed if a second x-ray enters the detector before a prior pulse is fully processed. If analysis of the prior pulse had not yet been complete, it is also to be blocked from further processing. If this blockage is not performed, pulse pile-up occurs, resulting in an artifact which appears at energies equal to the sum of the photon energy of the first and second photons to enter the detector. These are frequently called sum peaks.
Despite pulse pile-up rejection circuitry, sum peaks are observed for intense peaks in the spectrum. This is the result of two photons entering the detector simultaneously or within a time difference faster than the fast discriminator can act. Sum peaks can be observed at twice the energy of an intense peak and / or at the sum of the energies of two intense peaks in the spectrum. Sum peaks decrease rapidly in intensity with count rate. The importance of electronic pulse-processing components to system performance is easily overlooked in EDS. However, stability, linearity, and proper calibration of these components are important for the use of the spectrometer.
EDXRF spectrometers require a dedicated computer system for data acquisition. Early spectrometers were heavy, unwieldy units which used hard-wired multichannel analyzers which could acquire data, but could do little to process it. Current spectrometer and data systems based on microprocessor technology are available as table-top units.
Fundamentals of operation – The simultaneous multi-element capability of EDS complicates the selection of optimum conditions because of the factors to be considered for each element. The compromises in spectroscopy are to be made, but the initial selection of instrument operating conditions can follow a logical sequence of decisions.
Qualitative analysis needs similar procedures, normally with less stringent requirements. Once a sample is received for analysis and the elements to be determined by x-ray spectrometry are identified, the next decision is to ascertain which x-ray lines are to be used for the determinations. As a general rule, K lines are used upto a K absorption-edge energy a few keV below the characteristic line of the x-ray tube anode element. The continuum can be used for excitation if the voltage to the x-ray tube is set sufficiently high to place the continuum maximum at energy higher than the absorption edge and if a back-ground filter is used. In these cases, K absorption-edge energies can be used upto around 66 % of the maximum operating kV of the x-ray tube. However, the observed peaks lie on a continuum background and reduce the signal-to-noise ratio.
For a 50-kV x-ray tube, absorption edges as high as 30 keV can be used if the element is present in sufficient concentration. For a 30-kV rhodium or silver tube, one is restricted essentially to excitation by the characteristic tube lines. This is of no great concern unless there is a special interest in the elements between atomic numbers 41 and 50 (niobium to tin). Elements above atomic number 50 (40 for a 30-kV system) are normally to be determined using the L lines of their x-ray spectra.
To excite all L lines, the incident x-ray photon energy is to exceed the LI absorption edge. For practical use, the energy of the L lines is to be higher than around l keV. For the L line spectra, this needs atomic numbers higher than 30. At such low x-ray energies, absorption of the x-rays and low fluorescent yield in the L emission in this region needs high concentration of the element to be determined and excellent sample preparation. Overlap of the K lines of the low atomic number elements in this region also causes difficulty. For example, the K lines of phosphorus overlap with the L lines of zirconium and the M lines of iridium at around 2 keV. These problems are to be considered, but are to a large degree solved by careful use of processing software.
Once the x-ray spectral lines are selected for determination of the elements, the next step is to decide whether all analyte elements in the sample can be determined with one instrumental setting. Although the multi-element capability of EDS is useful, all elements in every sample cannot be determined with a single set of instrument parameters. Some applications need more than one condition, such as a mixture of low atomic number elements and transition elements. The transition elements are best determined by excitation using the K lines of rhodium or silver and the low atomic number elements with the L lines or a properly adjusted continuum using a background filter. Computer control of instrument parameters facilitates changing the conditions. Whether automatic or manual control is used, all samples are to be analyzed under one set of conditions, then analyzed again using the alternate set. This is preferred over changing conditions between samples.
X-ray tube operating voltage affects the efficiency of excitation of each element in the spectrum and the integrated x-ray photon flux from the tube. The tube current affects the flux only. Hence, once the operating kV has been set, the tube current typically is adjusted until the system is processing counts efficiently. System dead time is to be maintained below, but near, 50 %. The voltage and current settings for the x-ray tube have a sensitive effect on the rate of information acquisition and count distribution among the respective spectral peaks for a given type of sample.
Selection of primary tube filter thickness is important. If the filter is changed, the tube current, and sometimes the voltage, frequently needs resetting since the filter alters the intensity distribution of the x-rays striking the sample. When characteristic tube lines are used for excitation, the filter is normally made from the tube anode element. The intensity of the transmitted x-rays decrease exponentially with increasing filter thickness. It is common to have two or three primary filters made from the tube anode element in the filter holder. The selection is to reflect optimum count rate corresponding with reasonable current and voltage settings. Thicker filters attenuate lower energy radiation more effectively and reduce the excitation efficiency for the element with low absorption coefficients.
The remaining decision is the choice of atmosphere in the sample chamber. If x-rays below around 5 keV are to be implemented, use of a vacuum can be advantageous. Intensity can increase sufficiently to reduce significantly the counting time needed to achieve an adequate number of counts. If the concentration of elements yielding these x-rays is sufficiently high, the vacuum may not be needed. Because of the extra precautions needed in sample criteria and handling, a vacuum path is not to be used unless significant benefit is realized. Similar reasoning applies to the helium atmosphere.
These guidelines are useful for initial selection of operating conditions. The instrumental parameters are interactive, and a change in one parameter needs adjustment of another. For example, selection of a thicker primary filter or a decrease in the tube voltage needs an increase in the tube current.
Sample preparation
The care taken to determine the best method of sample preparation for a given material and careful adherence to that method frequently determine the quality of results obtained. Sample preparation is the single most important step in an analysis, yet it is frequently given the least attention. In most cases, the stability and overall reproducibility of x-ray instrumentation are the least significant factor affecting the precision of analytical measurements. Frequently, the precision of analytical results expected from x-ray spectrometric determinations is expressed in terms of the theoretical statistics of measurement of x-ray intensities.
When replicate samples are prepared and actual standard deviations measured, deviations are found to be larger than those predicted by counting statistics. If precision is poor, any one analytical result can also be poor, since it can differ substantially from the ‘true’ value. The variety of sample types which can be analyzed using x-ray spectrometry necessitates different sample preparation techniques.
Samples are frequently classified as infinitely thick or infinitely thin based on measurement of the attenuation of x-rays. Samples are considered to be infinitely thick if further increase in the thickness yields no increase in observed x-ray intensity. The critical value for infinite thickness depends on the energy of the emitted x-radiation and the mass absorption coefficient of the sample matrix for those x-rays. For pure iron, the critical thickness is around 40 m for iron x-rays.
Although infinitely thin samples afford several advantages, it is rarely feasible to prepare them from routine samples. Many samples fall between these two cases and need extreme care in preparation. In addition to preparation of the sample, precise positioning of the sample in the spectrometer is critical for quantitative determinations.
Solid samples – These are defined as single bulk materials, as opposed to powders, filings, or turnings. Solid samples can frequently be machined to the shape and dimensions of the sample holder. The processing is not to contaminate the sample surface to be used for analysis. In other cases, small parts and pieces are to be analyzed as received. The reproducible positioning of these samples in the spectrometer is critical. It is frequently useful to fashion a wax mould of the part which fits into the sample holder. Using the mould as a positioning aid, other identical samples can be reproducibly placed in the spectrometer.
Samples taken from unfinished bulk material frequently needs surface preparation prior to quantitative analysis. Surface finishing can be done using a polishing wheel, steel wool, or belt grinder, with subsequent polishing using increasingly fine abrasives. Surface roughness less than 100 micrometers is normally sufficient for x-ray energies above around 5 keV, but surface roughness of less than 20 micrometers to 40 micrometers is needed for energies down to around 2 keV. Several precautions are necessary. Alloys of soft metals can smear on the surface as the sample is polished, resulting in a surface coating of the soft metal which yields high x-ray intensities for that element and subsequently high analytical results.
Polishing grooves on the surface of the sample can seriously affect the measured intensity of low-energy x-rays. This can be examined by repetitive measurement of the intensity of a sample after 45 degrees or 90 degrees rotation. Use of a sample spinner reduces this effect. If a sample spinner is not available, the sample is to be placed in the spectrometer such that the incident x-radiation is parallel to the polishing direction.
Powders and briquettes – Powder samples can be received as powders or prepared from pulverized bulk material too inhomogeneous for direct analysis. Typical bulk samples pulverized before analysis are ores, and refractory materials. Powders can be analyzed using the spectrometer, pressed into pellets or briquettes, or fused with a flux, such as lithium tetra borate. The fused product can be reground and pressed or cast as a disk. For precise quantitative determinations, loose powders are rarely acceptable, especially when low-energy x-rays are used. Pressed briquettes are more reliable. However, experience indicates that the best compromise is reground and pressed fusion products. This technique eliminates several problems associated with particle-size effects.
Particle-size effects result from the absorption of the incident and emitted x-rays within an individual particle. If the mass absorption coefficient of the sample matrix is high for the x-radiation used, particles even a few microns in diameter can considerably affect attenuation of the radiation within each particle. If the sample consists of particles of various sizes, or the particle size varies between samples, the resulting x-ray intensities can be difficult to interpret. This problem is compounded by the tendency of a material composed of a mixture of particle sizes to segregate when packed.
Determination of elements using low-energy x-radiation can lead to errors from particle-size effects of as much as 50 %. If the needed speed of analysis prohibits use of fusion techniques, direct determination from packed powders can be considered. The sample is to be ground, if possible, to a particle size below the critical value. The grinding time needed frequently can be ascertained by measuring the intensity from a reference sample at increasing grinding times until no further increase is observed. The lowest energy x-ray to be used in analysis is to be selected for this test.
Briquettes or pressed powders yield better precision than packed powder samples and are relatively simple and economical to prepare. In several cases, only a hydraulic press and a suitable die are needed. In the simplest case, the die diameter is to be the same as the sample holder so that the pressed briquettes fit directly into the holder. The amount of pressure needed to press a briquette which yields maximum intensity depends on the sample matrix, the energy of the x-ray to be used, and the initial particle size of the sample. Hence, prior grinding of the sample to a particle size which is less than 100 micrometers is advisable.
A series of briquettes are to be prepared from a homogeneous powder using increasing pressure. The measured intensity of the x-ray lines to be used in the analysis is plotted versus the briquetting pressure. The measured intensity is to approach a fixed value, perhaps asymptotically. Pressures of 138 MPa to 276 MPa may be needed. For materials which do not cohere to form stable briquettes, a binding agent is needed. Acceptable binding agents include powdered cellulose, detergent powders, starch, stearic acid, boric acid, lithium carbonate, polyvinyl alcohol, and commercial binders.
Briquettes which are not mechanically stable can be improved by pressing them into backing of pre-pressed binder, such as boric acid, or by the use of a die which presses a cup from a binding agent. The sample powder can then be pressed into a briquette supported by the cup. Improved results are frequently achieved if around 0.1 mm to 0.5 mm is removed from the surface of the briquette prior to the measurement.
Fusion of materials – Fusion of materials with a flux can be performed for several reasons. Some refractory materials cannot be dissolved, ground into fine powders, or converted into a suitable homogeneous form for x-ray spectrometric analysis. Other samples can have compositions which lead to severe inter-element effects, and dilution in the flux reduces these. The fused product, cast into a glass button, provides a stable, homogeneous sample well suited for x-ray measurements. The disadvantages of fusion techniques are the time and material costs involved as well as the dilution of the elements which can result in a reduction in x-ray intensity. However, when other methods of sample preparation fail, fusion frequently provides the needed results.
Low-temperature fusions can be carried out using potassium pyro-sulphate. More common are the glass-forming fusions with lithium borate, lithium tetra-borate, or sodium tetra-borate. Flux-to-sample ratios range from 1:1 to 10:1. The lithium fluxes have lower mass absorption coefficients and hence less effect on the intensity of the low-energy x-rays. An immense variety of flux-additive recipes are reported for various sample types. Lithium carbonate can be added to render acidic samples more soluble in the flux. Lithium fluoride has the same effect on basic samples. Lithium carbonate also reduces the fusion temperature. Oxidants, such as sodium nitrate and potassium chlorate, can be added to sulphides and other mixtures to prevent loss of these elements.
Filters and ion-exchange resins – Various filters, ion-exchange resin beads, and ion-exchange resin-impregnated filter papers have become important sampling substrates for samples for x-ray spectrometric analysis. Filter materials can be composed of filter paper, membrane filters, glass fiber filters, and so on. Filters are used in a variety of applications. One widely used application is in the collection of aerosol samples from the atmosphere. Loadings of several milligrams of sample on the filter can correspond to sampling several hundred cubic meters of atmosphere. Such sampling can be performed in any environment. Many elements can be determined directly on these filters by x-ray spectrometric analysis. Particulate samples collected in this way present problems, stemming primarily from particle-size effects, which are reduced in part by the need to collect two particle-size regions using dichotomous samplers. With these units, particles are separated into those smaller and those larger than around 2 micrometers in diameter.
The smaller particles tend to represent man-made materials; the larger ones are of natural origin. The smaller particles show fewer particle-size effects, and an x-ray spectrometric determination of even low atomic number elements, such as sulphur, is possible. Glass fiber filters are frequently used for this purpose. Filters can also be used for non-aerosol atmospheric components, such as reactive gases. Filter materials can be impregnated with a reagent reactive to the gas which traps it chemically. Sampling is accomplished by conveying atmospheric gases through a treated filter under carefully controlled conditions. An example is a damp filter treated with ferric ion solution used to trap hydrogen sulphide. The excess iron can be rinsed from the filter, but the precipitated ferrous sulphide remains. The sulphur can be determined directly or indirectly by measuring the iron x-radiation. The key to determining atmospheric components is the development of suitable standards.
Filters can be used to determine solution components in ways parallel to those described for atmospheric components. Particulate materials can be filtered directly from solution. For example, particulate materials in environmental water samples are defined as that which is filtered using a 0.45 micrometer pore diameter membrane filter. Hence, filtration of particles from water can be accomplished using such filters, and direct x-ray spectrometric analysis performed. Application of filter sampling to dissolved elements in water is becoming more common. The principle is similar to the reactive reagent-impregnated filter application to atmospheric gases. In some cases, the filter can be impregnated with ion-exchange resins which trap ions as the solution passes through the filter.
Procedures using ion-exchange resin-impregnated filters are to be carefully checked, since several passes of the solution can be needed, and distribution of the ions across the paper thickness is seldom uniform. However, for solutions, a reaction can be performed prior to filtration. For example, many ions can be precipitated quantitatively from aqueous solution, even at parts per billion concentration levels. The precipitates can be collected using 0.45 micrometers pore diameter membrane filters, which are then mounted between two Mylar sheets retained by ring clips on a standard plastic sample cup. Simultaneous multi-element determinations are then performed using XRF spectrometer.
Detection limits on the filters of as low as a few tenths of a microgram are common. If 100 g of sample solution is used, this corresponds to the detection limits of a few parts per billion in the sample. Standards are easily prepared as aqueous solutions. ‘Standard reference materials’ (SRM) for environmental waters and industrial effluent water are available.
Thin-film samples – Thin-film samples are ideal for x-ray spectrometric analysis. The x-ray intensity of an infinitely thin sample is proportional to the mass of the element on the film, and the spectral intensities are free of inter-element and mass absorption coefficient effects. However, in practice, perfect thin-film samples are rarely encountered. Powder samples of sufficiently small and homogeneous particle size can be distributed on an adhesive surface, such as cellophane tape, or placed between two drum-tight layers of Mylar film mounted on a sample cup.
More important thin-film types are platings and coatings on various substrates. Analysis of these sample types is increasingly important for the electronics industry. Of particular concern are measurements of film thickness and composition. Several techniques can be used, including the substrate intensity attenuation method, the coating intensity method, various intensity ratio methods, and the variable takeoff angle method. The last method is not practical in most commercial spectrometers. To be infinitely thin to most x-rays used in x-ray spectrometric analyses, the samples are to be 10 micrometers to 200 micrometers thick.
Liquids – Liquids can also be analyzed using x-ray spectrometry. The design of x-ray spectrometric instrumentation using inverted optics, in which the sample is above the x-ray source and detector, facilitates the use of liquid samples. This convenient geometry demands caution in the preparation of liquid samples to avoid damaging the source or detector by such accidents as spills and leaking sample cups.
Quantitative standards are easily prepared for liquid samples. However, since solvents are normally composed of low atomic number elements, the Rayleigh and Compton scatter intensity is high, which increases background and leads to high limits of detection. These problems can be minimized by use of suitable primary tube filters, which reduce the scattered x-radiation in the analytically useful region.
Care is to be taken with liquids containing suspended solids. If the suspension settles during the measurement time, the x-ray intensity of the contents of the sediment is enhanced. The x-ray intensity from solution components or homogeneous suspension can decrease as a result of sediment absorption, which leads to erroneous results. This possibility is tested by brief, repetitive measurements, beginning immediately after a sample is prepared. Any observed increase or decrease in intensity with time indicates segregation in the sample. In these cases, an additive which stabilizes the suspension can be used, or the suspended content can be collected on a filter for analysis.
Special sample types – Applications of x-ray spectrometric analysis do not always provide convenient samples which can fit one of the above categories. Non-destructive analyses are occasionally needed on production products which are not 32 mm diameter circles of infinite thickness. Examples include computer disks, machined parts, and long, coated strips or wire. In these cases, a sample compartment which accommodates the samples can frequently be designed. With the development of the mercuric iodide detector, which can provide adequate resolution for many analyses without a liquid nitrogen dewar, special analytical systems for on-line and non-destructive analysis of large samples can become increasingly feasible.
製造プロセス