


希土類ドープペロブスカイトマンガン酸化物ナノ構造の研究の進歩
要約
ペロブスカイトマンガン酸塩は、1994年に巨大磁気抵抗効果が発見されて以来、広く研究されている幅広い構造的、電子的、磁気的特性を示します。親のペロブスカイトマンガン酸塩酸化物と比較して、化学組成を持つ希土類ドープペロブスカイトマンガン酸塩酸化物Ln x の A 1-x MnO 3 (LnはLa、Pr、Ndなどの希土類金属元素を表し、AはCa、Sr、Baなどの二価アルカリ土類金属元素です)希土類ドーピングが原子価状態の変化をもたらすため、非常に多様な電気的特性を示します輸送特性の中心的な役割を果たすマンガンの。技術的な重要性だけでなく、大きな注目を集めている異常な磁気特性と輸送特性の背後にある基本的なメカニズムを理解する必要もあります。今日、統合と小型化に向けた電子デバイスの急速な発展に伴い、希土類をドープしたペロブスカイトマンガン酸塩に基づくマイクロエレクトロニクスデバイスの特徴サイズは、ナノスケールの寸法に縮小されています。ナノスケールでは、希土類をドープしたペロブスカイトマンガン酸化物ナノ構造のさまざまな有限サイズ効果により、このシステムのより興味深い新しい特性がもたらされます。近年、かなりの実験的および理論的努力の結果、希土類をドープしたペロブスカイトマンガン酸化物ナノ構造で多くの進歩が達成されました。この論文は、希土類ドープペロブスカイトマンガン酸化物ナノ構造の製造、構造特性、物理的特性、および機能的応用に関する研究の最先端の概要を示しています。私たちのレビューは、最初に、希土類をドープしたペロブスカイトマンガン酸塩の研究履歴と注目すべき発見の簡単な紹介から始まります。第2部では、希土類をドープしたペロブスカイトマンガン酸化物ナノ構造を製造するためのさまざまな方法を要約します。次に、希土類をドープしたペロブスカイトマンガン酸化物ナノ構造の構造特性と多機能特性を詳細にレビューします。以下では、磁気メモリデバイスおよび磁気センサー、スピントロニックデバイス、固体酸化物燃料電池、磁気冷凍、生物医学、および触媒の分野における希土類ドープペロブスカイトマンガン酸化物ナノ構造の潜在的な用途に焦点を当てています。最後に、このレビューは、希土類をドープしたペロブスカイトマンガン酸化物ナノ構造の将来の研究のためのいくつかの展望と課題で締めくくられています。
はじめに
ペロブスカイトマンガン酸塩は、AMnO 3 の一般的な組成を持つマンガン化合物のファミリーを指します ここで、A =La、Ca、Ba、Sr、Pb、Nd、Prは、鉱物CaTiO 3 にちなんで名付けられたペロブスカイト構造で結晶化します。 。組成に応じて、強磁性、反強磁性、電荷、軌道秩序などのさまざまな磁気的および電気的現象を示します。したがって、これらの特性は、センサーやスピントロニクスデバイスの分野での潜在的な用途があります。ペロブスカイトマンガン酸塩の初期の研究は1950年に始まり、JonnerとVanSantenによって最初に実施されました[1]。彼らは、Mn 4+ の比率の変化を発見しました。 LaMnO 3 に、ドーピング率の異なる二価アルカリ土類金属元素(Ca、Sr、Baなど)を導入する。 、キュリー温度の変化につながる可能性があります(つまり、 T C )および飽和磁化。それ以来、「マンガン酸塩」という用語は、3価および4価のマンガンを含むこれらの化合物を指すために採用されました。 1年後、ツェナー[2]は、磁性と電気伝導の間の異常な相関関係を説明するために「二重交換」(DE)メカニズムを提案しました。これは、JonnerとVanSantenによって報告されました。ツェナーの理論的研究に基づいています。 DEメカニズムはさらに詳細に開発されました[3,4,5]。同時に、実験的研究も行われました。
親のペロブスカイトマンガン酸塩酸化物と比較して、化学組成がLn x の希土類ドープペロブスカイトマンガン酸塩酸化物 A 1-x MnO 3 (LnはLa、Pr、Ndなどの希土類金属元素を表し、AはCa、Sr、Baなどの二価アルカリ土類金属元素です)希土類ドーピングが原子価状態の変化をもたらすため、非常に多様な電気的特性を示します輸送特性の中心的な役割を果たすマンガンの。たとえば、LaをドープしたSrMnO 3 (La 0.7 Sr 0.3 MnO 3 )は強磁性(FM)金属ですが、SrMnO 3 は反強磁性(AFM)絶縁体です。 Wollan and Koe [6]。一連の希土類ドープペロブスカイトマンガン酸化物酸化物Ln x を発見しました Ca 1-x MnO 3 相対的なイオンマンガン含有量(Mn 3+ )に応じてFMおよびAFM特性の特徴を備えています およびMn 4+ )。 1994年に、ジン等。 [7]は、ペロブスカイトLa 0.67 の超巨大磁気抵抗(CMR)効果について最初に報告されました。 Ca 0.33 MnO 3 LaAlO 3 で成長した薄膜 レーザーアブレーションによる基板。数テスラの磁場により、La 0.67 のエピタキシャル薄膜の抵抗が1000倍変化する可能性があります。 Ca 0.33 MnO 3 。それ以来、ペロブスカイトマンガン酸塩が再び大きな関心を集め、理論と実験の両方がさらに進歩しました。 1995年に、ミリス等。 [8]は、実験結果で観察された現象は、 T のすぐ下の抵抗率の急激な低下など、二重交換だけでは説明できないことを指摘しました。 C 。やがて、ミリス等。 [9]は、マンガナイトの本質的な物理学が、ヤーン・テラー効果[10]から生じる電子-フォノン結合と二重交換メカニズムとの間の相互作用によって支配されることを示しました。その後、この新しい理論とヤーン・テラー効果が採用され、議論されました[11、12]。新規の物理的輸送特性をより合理的に説明するために、近年、1軌道モデル(単純だが不完全)や2軌道モデル(悪名高い軌道秩序を説明するために不可欠)など、多くの理論モデルが提案されています。 Mn酸化物の傾向)[13]。 1998年から1999年にかけて、ダゴットと彼の共同研究者[14、15]は、相分離の傾向がマンガナイトに現れる相分離の理論を開発しました。徐々に、相分離理論が検証され、ペロブスカイトマンガン酸化物を説明する主流の理論として認識されました[16、17]。
希少な地球にドープされたペロブスカイトマンガナイト酸化物は、CMR効果、金属-絶縁体(M-I)遷移、電子相分離(EPS)、複雑な構造相など、幅広い新しい特性を示す高度に相関するシステムのグループに属しています。スピン、電荷、軌道、および格子の自由度の間の複雑な相互作用のために、それらの状態図で。技術的な重要性だけでなく、大きな注目を集めている異常な磁気特性と輸送特性の背後にある基本的なメカニズムを理解する必要もあります。今日、統合と小型化に向けた電子デバイスの急速な発展に伴い、希土類をドープしたペロブスカイトマンガン酸塩に基づくマイクロエレクトロニクスデバイスの特徴サイズは、ナノスケールの寸法に縮小されています。ナノスケールでは、希土類をドープしたペロブスカイトマンガナイトオキシドナノ構造(たとえば、ゼロ次元(0D)、1次元(1D)、および2次元(2D)ナノ構造)のさまざまな有限サイズ効果により、このシステム。過去20年間で、希土類をドープしたペロブスカイトマンガン酸化物ナノ構造の研究は、かなりの実験的および理論的努力の結果、大きな進歩を遂げました。この論文では、希土類をドープしたペロブスカイトマンガン酸化物ナノ構造の最新技術の概要を紹介します。これには、製造、構造特性、特性、および機能アプリケーションが含まれます。多大な研究努力とスペースの制限のために、既存のすべての話題の文献の完全な概要を提供することは不可能であり、したがって、私たちは選択された、しかし代表的な結果に限定します。可能な限り、読者は総説、本、および/または希土類にドープされたペロブスカイトマンガン酸化物ナノ構造に関する選択されたサブトピックが完全に詳細に議論されている章を参照されます。また、この総説は、製造方法の観点からだけでなく、マイクロエレクトロニクス、磁気、スピントロニクスデバイス、固体酸化物燃料電池、磁気冷凍、生物医学、および触媒。この概要は、希土類をドープしたペロブスカイトマンガン酸化物ナノ構造の将来の研究のためのいくつかの展望と課題で終わります。
希土類ドープペロブスカイトマンガン酸化物ナノ構造の合成方法
希土類ドープペロブスカイトマンガン酸化物ナノ粒子
溶融塩合成
溶融塩合成(MSS)法は、シンプルで用途が広く、環境にやさしいアプローチであり、制御可能な組成と形態を備えた高純度でナノスケールの無機酸化物を合成するために広く使用されています。このアプローチでは、無機溶融塩が反応媒体として機能し、反応速度を高め、反応酸化物の反応温度を下げます[18]。溶融塩中の反応酸化物の拡散距離が短く、移動度が大きいため、固体反応全体は、中程度の温度(600〜800°C)で短い滞留時間(1時間未満)で簡単に実行できます。低い形成温度に加えて、溶融塩は最終製品の特定の形態を安定させることも促進します。さらに、最終製品の形態は、MSS処理パラメーター(たとえば、使用される溶融塩の種類と量、さまざまな反応酸化物、アニーリング温度と滞留時間、および加熱/冷却速度)を調整することによって適切に制御できます。 MSSプロセス。
近年、MSS法は、希土類をドープしたペロブスカイトマンガン酸化物酸化物ナノ粒子の合成に成功裏に使用されています。たとえば、Luo etal。 [19]合成されたLa 0.7 Sr 0.3 MnO 3 (LSMO)MSSルートを介した粉末。化学量論的La(NO 3 ) 3 ・6H 2 O、Sr(NO 3 ) 2 、およびMn(NO 3 ) 2 出発材料として使用され、KNO 3 溶融塩として使用されました。 KNO 3 のモル比を制御することにより 金属硝酸塩と反応温度から、平均粒径が20〜50nmに変調されたLSMO粒子が得られました。これらのナノサイズのLSMO粉末では、特に低温で、大幅に強化された磁気抵抗が観察されました。 Tian etal。 [20] La 1-x を合成するための簡単な溶融塩合成ルートを開発しました Sr x MnO 3 ( x =0、0.3、0.5、0.7)ナノ粒子、ここで共晶NaNO 3 –KNO 3 混合物を溶融塩として使用し、La、Mn、およびSrの硝酸塩を試薬として使用しました。 La 1-x の平均粒径 Sr x MnO 3 ( x =0、0.3、0.5、0.7)粒子は、それぞれ約20、20、19、および25nmでした。後で、同じ方法によって、Tian等。 [21]もLa 0.67 を合成しました Sr 0.33 MnO 2.91 粒子サイズが20〜60nmのナノ粒子。 Xia etal。 [22]単結晶La 1-x も合成 Ca x MnO 3 ( x を使用したLCMO =0.3および0.5)MSS法によるナノ粒子。ここで、共晶NaNO 3 –KNO 3 混合物を溶融塩として使用した。 NaNO 2 を使用する 溶融塩として、Kačenka等。 [23]合成されたLa 1-x Sr x MnO 3 ( x =0.18–0.37)ナノ粒子は、ゾル-ゲル法で合成されたものと比較してかなり分離されていました。同様に、一連の単相La 1-x Sr x MnO 3 ( x =0.25–0.47)平均サイズが約50nmのナノ粒子も合成されました[24]。
メカノケミカル処理
超微粉を合成するための効果的、経済的、そして用途の広い方法として、メカノケミカルプロセッシング(MCP)は、高エネルギーボールミルによって機械的に活性化される化学反応を利用します。室井ほか[25]は、MCPによるペロブスカイトマンガナイトの合成に関する先駆的な研究を実施しました。出発物質はLaCl 3 でした。 、CaCl 2 、MnCl 2 、およびNa 2 CO 3 溶融塩として使用されました。それらは化学反応を介して適切な比率で混合され、La 0.7 を形成しました。 Ca 0.3 MnO 3 粒子サイズが20nm〜1.0μmの粉末。同様の方法に従って、Spasojevic等。 [26] La 0.7 を合成しました Ca 0.3 MnO 3 シングルステップ処理での高エネルギーボールミルによる平均サイズ9nmのナノ粒子。メカニカルアロイング法により、Li etal。 [27]はLa 2/3 も合成しました Ca 1/3 MnO 3 粒子サイズが〜18nmの粉末。別の研究では、マンのグループがLa 0.7 を合成するための一連の研究を実施しました。 Ca 0.3 MnO 3 反応性粉砕法によるナノ粒子[28、29、30、31、32]。彼らは、合成されたままのLa 0.7 Ca 0.3 MnO 3 ナノ粒子はブロッキング温度で超常磁性挙動を示しましたが、粉砕時間が8時間から16時間に増加するにつれて減少しました[28]。 La 0.7 の他に Ca 0.3 MnO 3 ナノ粒子、La 0.7 Sr 0.3 MnO 3 ナノ粒子はまた、異なる粉砕時間での反応性粉砕法によって合成された[30、31]。最近、La 0.7 Ca 0.3 MnO 3 粒子サイズが21〜43 nmのナノ粒子も、反応性ミリングおよび熱処理法によって合成されました[32]。
ウェットケミカルルート
Sol-Gelプロセス
ゾルゲル法は、ペロブスカイト酸化物材料などの多成分金属酸化物を合成するための一般的な方法です。このプロセスでは、金属アロキシド、金属有機、または金属無機塩の前駆体を適切な溶媒に溶解し、続いてゲルを乾燥させてから焼成し、高温で焼結してペロブスカイト酸化物材料を形成することにより、ゾルを形成します。
Ravi etal。 [33]は、LSMOナノ粒子を合成するために修正ゾルゲル法を使用しました。ここでは、シュウ酸をキレート剤として、オレイン酸をポリアクリル酸マトリックスの界面活性剤として、金属硝酸塩を出発物質として使用しました。キセロゲルを100℃に加熱し、大気中で乾燥させて粉末を得た。次に、これらの粉末を粉砕し、500〜800°Cの温度で4時間アニーリングして、さまざまな粒子サイズのLSMOナノ粒子を得ました。同様に、Pr 1/2 Sr 1/2 MnO 3 [34]、La 0.6 Pb 0.4 MnO 3 [35]、Nd 0.5 Sr 0.5 MnO 3 [36]、La 1-x Ca x MnO 3 [37]、Ln 0.67 Sr 0.33 MnO 3 (Ln =La、Pr、およびNd)[38]、およびPrをドープしたLa 0.67 Ca 0.33 MnO 3 ナノ粒子[39]もこの方法で合成されました。それらの粒子サイズは、アニーリング温度によって適切に制御できます。 Sarkar etal。 [40]は、Pr 0.5 を合成するためにゾルゲルベースの高分子前駆体ポリオールルートを採用しました Ca 0.5 MnO 3 粒子サイズが10nmまでのナノ粒子。彼らの研究では、ポリマーのエチレングリコールを使用して、前駆体溶液中に金属イオンの密接なネットワークを形成しました。これにより、反応が促進され、比較的低温での相形成が可能になります。
共沈法
共沈プロセスでは、溶液相からさまざまなイオン種を含む固体を分離します。沈殿物中の特定の成分を分離せずにすべての陽イオンの定量的かつ同時の沈殿が起こり、完全に混合金属の前駆体を形成することは非常にまれな状況です。これは、特に複数の金属イオンを含む溶液の場合、さまざまな沈殿相間の溶解度が異なることに起因します。通常、この問題は、陽イオンを不溶性にする沈殿剤(シュウ酸塩、酒石酸塩、クエン酸塩など)を導入することで修正できます。 Dyakonov etal。 [41]合成(La 0.7 Sr 0.3 ) 0.9 Mn 1.1 O 3 この方法によるマンガン酸化物ナノ粒子。化学量論量の高純度Mn 3 の混合物 O 4 、La 2 O 3 、およびSrCO 3 粉末を希硝酸に溶解しました。この溶液を蒸発させて乾燥させた後、500°Cで焼成して硝酸塩を分解しました。乾燥した残りの部分を再度完全に粉砕し、800〜950°Cの温度で空気中で20時間アニーリングした後、室温までゆっくりと冷却しました。得られた生成物を繰り返し粉砕し、平均粒子サイズが40、75、および100nmのナノ粉末を得た。パンら。 [42]もLa 0.7 を合成しました Sr 0.3 MnO 3 超音波処理支援共沈法によるナノ粒子。同様に、La 0.5 Ca 0.5 MnO 3 異なる平均サイズ(13、18、および26 nm)のナノ粉末は、それぞれ700、800、および900°Cでのアニーリング後に得られました[43]。改良された化学共沈法を使用することにより、Zi etal。 [44]合成されたLa 0.7 Sr 0.3 MnO 3 粒子サイズが50〜200nmのナノ粒子。
(マイクロ波-)水熱プロセス
水熱プロセスでは、オートクレーブ内の不溶性塩の水性懸濁液を適度な温度と圧力で加熱して、目的の相の結晶化を行います。水熱合成は、狭いサイズ分布と球状の形態を備えた非常に微細で均質なペロブスカイト粉末を調製するための強力な方法です。 Sin etal。 [45]単結晶La 1-x の合成について報告 Sr x MnO 3 セチルトリメチルアンモニウムブロミド(CTAB)と呼ばれる界面活性剤の存在下での熱水経路によるナノ粒子。分析グレードKMnO 4 、MnCl 2 ・4H 2 O、LaCl 3 ・7H 2 O、SrCl 2 ・6H 2 Oを出発原料として使用した。化学反応は、10mlのテフロンで裏打ちされたステンレス鋼のオートクレーブで行われ、添加されたKOHは適切なアルカリ性を維持しました。次に、CTAB粉末を上記の金属イオンを含む溶液と混合し、激しく攪拌して、均質な黒色の溶液を得た。反応混合物をオートクレーブに入れ、自生圧力下で240℃で1日間加熱した。得られた生成物を濾別し、エタノールおよび脱イオン水で洗浄して、残留CTAB、カリウムイオン、および塩化物イオンを除去した。最終生成物を80℃で2時間乾燥させて、少量の黒色火薬を得た。アーバンら。 [46]単結晶La 1-x も合成 Ba x MnO 3 ( x =0.3、0.5、および0.6)50〜100nmのサイズのナノキューブ。 Deng etal。 [47]はLa 1- x の合成を報告しました Sr x MO 3- δ (M =Co、Mn; x =0、0.4)水熱処理と組み合わせたクエン酸の修正戦略を使用した粒子[48]。彼らは、Srドーピングが化学量論を超える酸素の量の減少につながり、Mn 4+ も引き起こすことを発見しました。 濃度を上げて、触媒の酸化還元能力を向上させます。
マイクロ波-水熱(M-H)合成は、水熱合成手順中にマイクロ波加熱技術を使用することによる修正されたアプローチです。マイクロ波加熱方式は、反応速度と結晶化速度を大幅に向上させ、製造効率を高めることができます。最近、この方法は、希土類をドープしたペロブスカイトマンガン酸化物ナノ構造を合成するために使用されています。イフラら。 [49]は、La 0.8 のマイクロ波支援水熱合成を報告しました Ag 0.2 MnO 3 +δ ナノ粒子は、70nmの結晶子サイズで均質でした。さらに、La 0.8 Ag 0.2 MnO 3 +δ ナノ粒子はメタン触媒燃焼に優れていた。 Anwar etal。 [50]は、La 0.67 のマイクロ波支援水熱合成を報告しました Sr 0.33 MnO 3 平均結晶子サイズが11nmの棒状の形態をしたナノ粒子。
自然発火性反応プロセス
熱泳動反応プロセスは、メソポーラス炭素前駆体の形成と高温(800°C)でのそれらの煆焼を介した有機アミンと酸の配位金属化合物の水性前駆体溶液の熱分解を含みます。その原理は、過剰な試薬の熱分解中に、有機配位剤、すなわちトリエタノールアミンによって提供されるポリマーネットワーク内に複雑な金属イオンを原子的に分散させることです。前駆体溶液の熱分解中に、金属イオンまたはそれらの塩はナノクラスターを形成し、メソポーラスカーボンの結果として生じるマトリックスに埋め込まれます。その場での金属イオンの触媒効果に助けられて、500〜800°Cの低温での空気酸化による前駆体材料中のメソポーラス炭素のゆっくりとした揮発は、金属酸化物ナノ結晶の形成を促進します。酸化物ナノ粒子の調製におけるこの方法の利点は、製品の高純度、狭い粒子サイズ分布を持つ小さな粒子サイズ、優れた組成制御、および最終製品の化学的均一性です。
Dey etal。 [51] La 0.7 を取得 Ca 0.3 MnO 3 自然発火性反応プロセスによる平均サイズ17nmのナノ粒子。高純度のLa 2 O 3 、Mn(CH 3 COO) 2 、およびCaCO 3 出発材料として使用されました。同じ方法で、Giri等。得られたSm 0.5 Ca 0.5 MnO 3 およびSm 0.09 Ca 0.91 MnO 3 ナノ粒子[52,53,54,55]。これらのナノ粒子は交換バイアス効果を示し、冷却場によって効果的に調整できます。 Nagabhushana etal。 [56]はLa 1-x も合成しました Sr x MnO 3 +δ ナノ粉末、硝酸ランタンLa(NO 3 ) 3 ・6H 2 O、硝酸ストロンチウムSr(NO 2 ) 3 ・4H 2 O、および硝酸マンガンMn(NO 3 ) 2 ・4H 2 Oは酸化剤およびオキサリルヒドラジン、C 2 として使用されました H 6 N 4 O 2 (ODH)燃料として。シンデ他[57]は、単純な溶液燃焼技術による一連のSrドープランタンマンガナイトの合成について報告しました。 La 0.6 Sr 0.4 MnO 3 異なる粒子サイズのナノ粒子も、硝酸塩錯体自動点火法[58]によって合成されました。
熱分解合成
熱分解合成は、金属酸化物および複合酸化物ナノ粒子を調製するための、高速で、単純で、費用効果の高い合成ルートです。より小さなサイズの単分散磁性ナノ結晶は、本質的に、安定化界面活性剤を含む高沸点有機溶媒中での有機金属化合物の熱分解によって合成することができます。原則として、有機金属化合物、界面活性剤、および溶媒を含む出発試薬の比率は、磁性ナノ粒子のサイズと形態を制御するための決定的なパラメーターです。サイズと形態を正確に制御するには、反応の温度と時間、およびエージング期間も重要な場合があります[59]。この方法は、操作が簡単で便利で、低コストで直接収率が高く、すべての揮発性成分が揮発し、炭素不純物の問題が解決されます。
最近、黄等。 [60] La 0 を合成しました。 7 Sr 0 。 3 MnO 3 錯体剤としてエチレンジアミン四酢酸を使用することによる金属錯体の熱分解による粒子。 Daengsakulのグループ[61,62,63]もLa 1-x を合成しました Sr x MnO 3 出発物質としてLa、Sr、およびMnの酢酸塩を使用する熱分解法によるナノ粒子。 La 1-x のサイズを制御するには Sr x MnO 3 ナノ粒子、前駆体の熱分解は、さまざまな温度で実行されました。同様に、La 1-x Sr x MnO 3 ナノ粒子(0≤×≤0.5)は、水溶液中の出発物質としてLa、Sr、およびMnの酢酸塩を使用する簡単な熱分解法によって合成されました[62]。準備されたすべてのLa 1-x Sr x MnO 3 ( x ≤0.3)ナノ粒子は、熱分解温度が900°Cを超えたため、立方晶から菱面体晶に変化するペロブスカイト構造を持っていましたが、他のナノ粒子は立方晶構造のままでした。
その他のメソッド
Moradi etal。 [64] La 0.8 の合成について報告 Sr 0.2 MnO 3 マイクロ波照射プロセスによる異なる粒子サイズのナノ粒子。 Hintze etal。 [65]準備されたLa 1-x Sr x MnO 3 界面活性剤として使用されるCTABに基づく逆ミセルマイクロエマルジョンを介したナノ粒子。
1D希土類ドープペロブスカイトマンガン酸化物ナノ構造の調製方法
最近、ナノワイヤー、ナノロッド、ナノチューブ、ナノファイバー、ナノベルトなどの1Dペロブスカイトマンガナイトナノ構造は、0Dペロブスカイトマンガナイトナノ構造(または量子ドット)や2Dペロブスカイトナノ構造などの他の低次元システムと比較して、その独自の機能により大きな注目を集めています。 (または量子ウェル)。 2次元の量子閉じ込めは、1Dペロブスカイトマンガナイトナノ構造におけるキャリアの輸送のための1つの制限されていない方向であり、ナノサイズの寸法のために多結晶の対応物とは大幅に異なる新しい電気輸送と磁気特性を動作させることができます。さらに、それらはまた、物理的特性の固有のサイズ効果を調査するための優れたシステムを提供します。ナノスケールの次元でこれらの挙動を理解することは、新世代の革新的な電子ナノデバイスを開発するために重要です。ただし、十分に制御された寸法、均一なサイズ、相純度、および均質な化学組成を持つこれらのナノ構造の製造と合成には多くの課題があります。構造制御は特性とデバイス性能を制御するための重要なステップであるため、最近、核形成と成長プロセスを理解して制御するために、多くの物理的手法と化学合成アプローチが開発されています。過去10年間で、1D希土類ドープペロブスカイトマンガン酸化物ナノ構造の合成に大きな進歩が見られました。 1D希土類ドープペロブスカイトマンガン酸化物ナノ構造の実現に向けて最も一般的に採用されている手法は、「ボトムアップ」ルート(テンプレートベースの合成、水/ソルボサーマル合成、溶融塩合成、溶液ベースの金属-有機分解など)です。 、およびエレクトロスピニング)、および「トップダウン」アプローチ(集束イオンビーム(FIB)ミリング、ナノインプリントリソグラフィー(NIL)技術など)。基本的に、1D希土類ドープペロブスカイトマンガン酸化物ナノ構造への合成ルートは、(i)テンプレートフリー合成と(ii)テンプレート支援合成の2つの異なるカテゴリに分類できます。これらについて、以下に簡単に説明します。
テンプレートを使用しない合成
現在まで、水力/ソルボサーマル合成、MSS法、エレクトロスピニングプロセスなどのいくつかのテンプレートフリー法が、1D希土類ドープペロブスカイトマンガン酸化物ナノ構造を合成するために使用されてきました。たとえば、単結晶ペロブスカイトマンガン酸塩La 0.5 Ca 0.5 MnO 3 斜方晶構造のナノワイヤは、水熱法によって合成されました[66]。これらのナノワイヤは[100]方向に沿って成長し、直径が均一(〜80 nm)で、長さが数マイクロメートルから数十マイクロメートルの範囲でした。同様に、単結晶La 0.5 Sr 0.5 MnO 3 、La 0.5 Ba 0.5 MnO 3 、およびPr 0.5 Ca 0.5 MnO 3 立方晶構造のナノワイヤも水熱合成法で合成されました[67,68,69]。 Pr 0.5 で Ca 0.5 MnO 3 ナノワイヤでは、電荷秩序転移が抑制され、強磁性相が観察されたが、反強磁性転移は消失した[69]。 Datta etal。 [70]は単結晶La 0.5 も合成しました Sr 0.5 MnO 3 直径が約50nm、長さが最大10.0μmのナノワイヤー。これらのLa 0.5 Sr 0.5 MnO 3 ナノワイヤのFM-PM転移温度(キュリー温度、 T C )約325 Kで、単結晶のバルク値(〜330 K)に近い。これは、ナノワイヤの直径サイズを45 nmに縮小した後でも、機能的な動作が維持されることを示しています。単一のナノワイヤからの電気輸送測定は、ナノワイヤが5〜310 Kの測定温度範囲内で絶縁挙動を示すことを示しています。これは、バルクシステムと同様です。
シンプルでワンステップの効果的な方法として、エレクトロスピニング技術は、無機およびハイブリッド化合物ナノファイバーの合成にも使用されます[71、72]。さらに、繊維サイズは、印加電位、前駆体濃度、粘度、溶液の流量などのエレクトロスピニングパラメーターを変更することで簡単に制御できます[73、74]。良い例はLa 0.67 です。 Sr 0.33 MnO 3 直径80〜300 nm、長さ200μmのナノワイヤーを合成したJugdersuren etal。 [75]とLa 0.75 Sr 0.25 MnO 3 Huangらによって合成されたナノファイバー。 [76]さらに、多成分La x Sr 1-x Co 0.1 Mn 0.9 O 3-δ (0.3≤×≤1)およびLa 0.33 Pr 0.34 Ca 0.33 MnO 3 ナノファイバーはエレクトロスピニング法によっても合成され、次世代の高性能スーパーキャパシターと相分離ナノデバイスのカソード材料としてそれぞれ使用できます[77、78]。
希土類ドープペロブスカイトマンガン酸化物ナノロッドも、水熱合成などのテンプレートフリーの方法を使用して合成されます。たとえば、La 0.65 Sr 0.3 MnO 3 ナノロッドは、単純な水熱反応とそれに続く850°Cで2時間の空気中での煆焼によって首尾よく合成されました。直径が80〜120 nmの範囲にある小さなナノロッドは、互いに接続して、数百nm〜数ミクロンの長さの長いロッドを形成する傾向があります[79]。ナノサイズのLa 0.7 Ca 0.3 MnO 3 棒状の形態のマンガン酸塩も、異なるアルカリ性条件(10、15、および20 M)で水酸化ナトリウム(NaOH)と水酸化カリウム(KOH)の2つの鉱化剤の存在下で水熱法によって得られました[80]。
テンプレート支援メソッド
テンプレート支援法は、既存の1Dナノ構造(ナノポーラスシリコン、ポリカーボネートメンブレン、陽極酸化アルミニウム(AAO)メンブレンなど)をテンプレートとして使用し、適切なポリマー前駆体で満たす方法です。テンプレート内に含まれる溶液は、熱処理されてペロブスカイトマンガン酸化物酸化物材料を形成し、その後、化学エッチングまたは煆焼によってテンプレートを除去します。テンプレート支援法による1Dペロブスカイトマンガン酸化物ナノ構造の合成には、次の利点があります。(a)ナノアレイの構造はテンプレートの構造の影響を受けます。(b)テンプレートのチャネルは、材料の寸法サイズを制御します。 (c)テンプレートの細孔壁が材料の凝集を防ぎ、(d)大量のナノワイヤまたはナノチューブを大量に生成することができます。一般的に使用されるテンプレート支援法の中で、AAOをテンプレートとして組み合わせたゾルゲルテンプレート法が最も人気があり、La 0.8 などの高度に秩序化されたペロブスカイトマンガン酸化物ナノ構造の製造に広く使用されています。 Ca 0.2 MnO 3 直径が約30nmのほぼ均一なナノワイヤ[81]、およびLa 0.67 の順序付けられた配列 Ca 0.33 MnO 3 直径60〜70 nm、長さ数十ミクロンのナノワイヤー[82]。この方法の成功に続いて、La 0.6 のペロブスカイトマンガン酸化物ナノワイヤー Sr 0.4 CoO 3 およびLa 0.825 Sr 0.175 MnO 3 直径50nm、長さ数十ミクロンまでの長さも多結晶ペロブスカイト構造で合成されました[83]。 La 0.67 の順序付けられた配列 Sr 0.33 MnO 3 直径60〜70 nm、長さ数十ミクロンまでのナノワイヤーは、テンプレートとしてナノポーラスアルミナを組み合わせた単純なゾルゲルプロセスを使用して調製されました[84]。
光リソグラフィーも製造に使用されます(La 5 / 8-0.3 Pr 0.3 )Ca 3/8 MnO 3 (LPCMO)LaAlO 3 上にエピタキシャル成長させた単結晶LPCMO膜から始まるワイヤ (100)基板[85]。ワイヤの幅が狭くなると、LPCMOワイヤの抵抗率は、M–I遷移の近くで温度と磁場を変化させると、巨大で超鋭いステップを示します。超鋭い遷移の起源は、マンガン酸塩の浸透輸送に対する空間的閉じ込めの影響に起因する可能性があります。ハンら。 [86]はMgO / La 0.67 を製造しました Ca 0.33 MnO 3 直径約20nmの内部MgOコアとLa 0.67 を備えたコアシェルナノワイヤ Ca 0.33 MnO 3 厚さ約10nmのシェル層。ここで、垂直に整列した単結晶MgOナノワイヤは、目的の遷移金属酸化物をエピタキシャル堆積するための優れたテンプレートとして機能し、高品質のコアシェルナノワイヤにつながります。
ペロブスカイトマンガン酸化物ナノワイヤに加えて、ペロブスカイトマンガン酸塩酸化物ナノチューブも、ゾルゲルテンプレートベースの方法を使用して製造されます。 Curiale etal。 [87] La 0.67 などのペロブスカイト希土類マンガン酸化物ナノチューブを合成しました Sr 0.33 MnO 3 、La 0.67 Ca 0.33 MnO 3 、およびLa 0.325 Pr 0.300 Ca 0.375 MnO 3 、ゾル-ゲルテンプレート合成プロセスを使用する。ナノチューブの典型的な長さは約6〜8μmであり、La 0.67 の平均壁厚は45、60、および150nmでした。 Sr 0.33 MnO 3 、La 0.67 Ca 0.33 MnO 3 、およびLa 0.325 Pr 0.300 Ca 0.375 MnO 3 、 それぞれ。これらのナノチューブの壁は磁性ナノ粒子で構成されており、それらのサイズはマンガナイトのマルチドメイン形成の臨界サイズよりも小さくなっています。結果として、ナノチューブの壁を構成する各粒子は単一の磁区になります。
高度に秩序化されたペロブスカイトマンガン酸塩La 2/3 Ca 1/3 MnO 3 ナノチューブアレイ(均一な直径80 nm)も、AAOテンプレート支援合成とマイクロ波照射を組み合わせたシンプルで迅速なプロセスによって正常に合成されました[88]。この方法は、比較的低温でナノチューブアレイを製造するための迅速な実践的なルートを提供します。 La 0.325 の公称組成を持つ希土類酸化マンガンナノチューブ Pr 0.30 Ca 0.375 MnO 3 (外径800 nm、長さ4μm、壁厚100 nm未満)は、多孔質ポリカーボネートテンプレートを液体前駆体で細孔湿潤させた後、マイクロ波照射と800°Cでのさらなる煆焼(2段階熱治療)[89]。これらのナノチューブの壁の厚さは、約20nmの小さな結晶によって形成されていることがわかりました。ペロブスカイトラ 0.59 Ca 0.41 CoO 3 ゾルゲルテンプレート法で調製されたナノチューブは、酸素発生用の空気電極の触媒として使用でき、ナノ粒子で作られた電極と比較して優れた触媒活性と耐久性を示します[90]。これは、La 0.59 の有望なアプリケーションを示しています Ca 0.41 CoO 3 燃料電池および充電式金属空気電池の空気電極の電極触媒としてのナノチューブ。ペロブスカイトSm 0.6 Sr 0.4 MnO 3 直径200nmのナノチューブもゾルゲルテンプレート法で調製しました。それらの壁は、直径25nmのナノ粒子で構成されています[91]。ただし、これらのプロセスでは、テンプレートは通常、毛細管現象の唯一の推進力で直接ゾルに浸されます。高濃度のゾルの場合、特に細孔径が小さいテンプレートの場合、細孔の充填は非常に困難になります。低濃度のゾルの場合、通常、アニーリングプロセス中に多孔質テンプレートの深刻な収縮と亀裂が発生します。したがって、テンプレート支援法による結晶化品質の高いレアドープペロブスカイトマンガナイトナノチューブの合成は、依然として非常に困難です。
2D希土類ドープペロブスカイトマンガン酸化物ナノ構造の合成方法
2D希土類ドープペロブスカイトマンガン酸化物ナノ構造には、ペロブスカイトマンガン酸化物薄膜、ナノドットアレイ、ナノシート、ナノプレート、ナノウォールが含まれ、スピン、電荷、軌道、格子の自由度の複雑な相互作用により興味深い物理的特性を示します。それらは、高密度メモリおよびストレージ、センサー、およびスピントロニクスデバイスの分野で有望なアプリケーションを持っています。したがって、過去数年間で、2D希土類ドープペロブスカイトマンガン酸化物ナノ構造を製造するためのいくつかの方法が開発されました[92,93,94]。明確にするために、このセクションは3つのサブセクションに分かれています:地球にドープされたペロブスカイトマンガン酸化物薄膜および/または多層、平面構造に基づく2D地球にドープされたペロブスカイトマンガン酸化物ナノ構造、および希土類にドープされたペロブスカイトマンガン酸塩酸化物ナノシート。
希土類ドープペロブスカイトマンガン酸化物薄膜または多層
希土類ドープペロブスカイトマンガン酸化物薄膜または多層膜の成長は、出発物質を膜または多層膜に変え、その原子、分子、またはイオンから気体状態で生成し、次にそれらをきれいな基板の表面。出発物質を原子、分子、またはイオン化状態に変換するために使用される準備された方法も多様であり、パルスレーザー堆積(PLD)、真空蒸気堆積、RFマグネトロンスパッタリングなどの物理蒸着(PVD)法、および化学的方法が含まれます化学溶液蒸着(CSD)、化学蒸着(CVD)、有機金属化学蒸着(MOCVD)、分子線エピタキシー(MBE)など。次のセクションでは、PLD、CSD、CVD、MOCVD、MBE技術など、最も広く使用されている技術を間もなく紹介します。
パルスレーザー堆積
PLDは薄膜堆積技術であり、集束パルスレーザービームによって照射された1つまたは複数のターゲットをアブレーションすることによって薄膜を成長させます[95]。この方法では、高出力のパルスレーザービームが真空チャンバー内に集束され、堆積される材料のターゲットに衝突します。 PLDプロセスは一般に次の4つの段階に分けることができます[96]:ターゲットとのレーザー放射相互作用、アブレーション材料の動的、基板へのアブレーション材料の分解、基板表面での薄膜の核形成と成長。 PLDには、ターゲットからの物質の化学量論的移動、エネルギー種の生成、アブレーションプラズマ内のアブレーションされた陽イオンと分子酸素間の超熱反応、超高真空(UHV)からその中で、PLDプロセスの最大の特徴は、多くの材料のマルチカチオンターゲットからのアブレーションされた材料の化学量論的移動を実現し、フィルムの組成とほぼ同じ組成を実現できることです。ターゲットが複雑な化学量論を含む場合でも、ターゲット。さらに、堆積速度を容易に変化させる能力は、スパッタリング技術などの他の物理蒸着法と比較して、PLDの主要な特徴の1つです。成長条件(例えば、基板温度、チャンバー圧力、レーザーの影響、ターゲットから基板までの距離)を制御することにより、高性能の電気、磁気、および光学デバイス用に多くのペロブスカイトマンガン酸化物薄膜または多層を成長させることができます。たとえば、Lawler etal。 [97] La 1-x を成長させました Ca x MnO 3 PLDによる薄膜。 T で0.2≤×≤0.5のときに強磁性でした。 C ≈ 250 K. Harzheim etal。 [98]もLa 0.66 を成長させました Ba 0.33 MnO 3 PLDによるフィルム(厚さ範囲5〜250 nm)。それらのCMR効果は、MgO(100)およびSrTiO 3 上に堆積されたエピタキシャル薄膜の厚さに依存します。 (STO)(100)。 La 1-x の強磁性膜に室温付近の巨大磁気抵抗効果が観測された Sr x MnO 3 (0.16≤×≤0.33)(100)SrTiO 3 で成長 PLDによる基板[99]。 La 0.6 の原子的に定義されたエピタキシー Sr 0.4 MnO 3 MnO 2 を含む薄膜 終端層としての原子層もPLD法で実現しました。 4 nmの薄さのフィルムでも、 T で明確な磁気遷移を示します。 C =240 K、 T 未満の半金属伝導 C 、および最低温度までの新しい磁気抵抗挙動。 La 0.6 などの他の希土類ドープペロブスカイトマンガン酸化物薄膜 Pb 0.4 MnO 3 [100]、Nd 0.7 Sr 0.3 MnO z [101]、Sm 1-x Sr x MnO 3 [102]、およびPr 0.5 Ca 0.5 MnO 3 [103]は、PLDプロセスによってさまざまな温度と酸素分圧でその場で堆積されました。電荷秩序化されたエピタキシャルPr 1-x のひずみの影響を確認するには Ca x MnO 3 ( x =0.5、0.6)LaAlO 3 上に堆積した薄膜 (LAO)およびSrTiO 3 (STO)基板、Haghiri-Gosnet etal。 [104] Pr 1-x のラマン研究を実施 Ca x MnO 3 異なる厚さのフィルム。彼らは、A g (2)モード(MnO 6 の傾斜角度に関連) 八面体)は、温度、ドーピング、およびエピタキシャルひずみの変化によって引き起こされる格子の局所的な変化と歪みに非常に敏感でした。 Dhakal etal。 [105](La 1- y のエピタキシャル成長を実行 Pr y ) 0.67 Ca 0.33 MnO 3 (LPCMO)( y =0.4、0.5、および0.6)NdGaO 3 上の薄膜 (NGO)(110)およびPLDによるSTO(100)基質、およびLa 0.325 のEPSに対する空間的閉じ込めの影響 Pr 0.3 Ca 0.375 MnO 3 直径500nm〜20μmの単結晶ディスク(電子ビームリソグラフィーによってエピタキシャルLPCMO薄膜から製造)は、Shaoらによって調査されました。 [106]。直径800nm以上のディスクではEPS状態が基底状態のままであるのに対し、EPSドメインの特性長スケールよりも明らかにサイズが小さい直径500nmのディスクではEPS状態が消失することがわかります。 500 nm径のディスクでは、キュリー温度Tc未満のすべての温度で強磁性相のみが観察され、システムがEPS状態ではなく単相状態にあることを示しています。 Kurij etal。 [107]は、半金属強磁性La 0.7 によって形成された、半導体バリアを備えた全酸化物磁気トンネル接合を報告しました。 Sr 0.3 MnO 3 およびn型半導体SrTi 0.8 Nb 0.2 O 3 、設計されました。 La 0.7 の組成を持つ多層 Sr 0.3 MnO 3 (30 nm)/ Nb:STO(1.8–3.0 nm)/ La 0.7 Sr 0.3 MnO 3 (10 nm)/ La 0.7 Sr 0.3 Mn 0.93 Ru 0.07 O 3 (20 nm)は、TiO 2 へのパルスレーザー堆積によってその場で成長させました。 単一終端の(100)指向のSTO基板。接合部のNb:STO層の厚さは、1.8〜3.0 nmで変化し、さらに10nmの厚さのLa 0.7 Sr 0.3 MnO 3 層は、バリアへのRuの拡散を回避するのに役立ちました。 Nb:STOバリアを備えたトンネル接合は、欠陥の数が減り、品質が向上し、結果の再現性が向上し、20〜100 Kで100〜350%のTMR比が大きくなり、さらに3桁の低周波ノイズレベルの大きさの改善。これらの結果は、磁力計アプリケーション用のすべての酸化物センサーへの道を開きます。 Xu etal。 [108] La 0.7 のエピタキシャルについて報告 Sr 0.3 MnO 3 / SrRu 1-x Ti x O 3 (SR 1-x T x O)(001)指向の超格子(LaAlO 3 ) 0.3 (SrAl 0.5 Ta 0.5 O 3 ) 0.7 PLDによる(LSAT)および(001)指向のNGO単結晶基板。ペロブスカイト酸化物薄膜と超格子のエピタキシャル成長に関する優れたレビューは、文献[92,93,94]にあります。
化学溶液の堆積
CSDは、溶液成長、制御または停止沈殿などとも呼ばれます。ペロブスカイト薄膜の化学堆積は、適度に遅い化学反応から生じ、水との化学反応を犠牲にして、浸漬された基板表面に薄い固体層を形成します。前駆体溶液[109,110,111]。この方法では、陽イオン溶液と陰イオン溶液を混合し、イオン生成物が溶解度生成物を超えるか等しくなると、イオンが基板上および溶液中で核から結合するときに沈殿が発生します。ペロブスカイトマンガン酸化物薄膜は、電界を印加せずに金属塩の適切な溶液に浸すことにより、金属または非金属基板上に成長させることができます。堆積は、還元剤による溶液中での均一な化学反応、通常は金属イオンの還元によって発生する可能性があります。成長速度と結晶化度は、溶液の温度に依存します。この方法には、大面積の薄膜堆積、低温での堆積、金属基板の酸化や腐食の回避など、多くの利点があります[112]。
これまで、多くのペロブスカイトマンガン酸化物薄膜または多層膜がCSD法によって合成されてきました。 Hasenkox etal。 [113]は、磁気抵抗La 1-x を調製するための柔軟なCSD法について報告しました。 (Ca、Sr) x MnO 3 完全に金属プロピオン酸塩に基づく薄膜。田中ほか[114]も成長しました(La、Sr)MnO 3 CSD法によるSTO(100)単結晶基板上の薄膜。 Solanki etal。 [115] La 0.7 の輸送および磁気輸送特性を測定しました Pb 0.3 MnO 3 CSD技術によって単結晶LAO(100)基板上に成長した薄膜。 La 0.7 の構造、表面、および電気的特性 Ca 0.3 MnO 3 およびLa 0.7 Sr 0.3 MnO 3 (100)-に堆積した薄膜 CSD技術による配向LAO単結晶基板も調査されました[116、117]。 PrをドープしたLa 0.8-x Pr 0.2 Sr x MnO 3 ( x =0.1、0.2、および0.3)薄膜も、CSD法[118]によってSTO(100)単結晶基板上に成長しました。 CSD法によるペロブスカイトマンガン酸化物薄膜の成長に関する詳細は、Schwartz [111]およびZhangetal。から寄稿された優れたレビューに記載されています。 [119]。
CVDおよびMOCVD
CVDは、ペロブスカイト酸化物機能性ナノ材料を合成するための最も一般的なルートの1つです。大面積ウェーハや複雑なパターン基板上に高品質で高性能な薄膜を作製するためによく使用されます。 CSDとの主な違いは、前駆体としての溶液の代わりに、基板上にガス状の前駆体を堆積させることにより、CVDによって材料が調製されることです。したがって、前駆体として高い蒸気圧組成が必要であり、多くの場合、堆積反応と吸着原子の動きを促進するために、基板を特定の温度に加熱する必要があります[120]。 CVDプロセスでは、膜の組成と構造は、基板温度、前駆体供給率、および気化器温度にかなり敏感です。 CVDプロセスには、堆積速度が速く、堆積温度が低いという利点があります。 CSDプロセスと比較して、それらは形態、結晶構造および配向のはるかに優れた制御を提供し、その結果、エピタキシャルペロブスカイト酸化物薄膜を調製するためにしばしば使用されます[121、122、123]。 Herrero etal。 [124]ペロブスカイトマンガン酸塩La 1-x の成長について報告 A x MnO 3 (A =Ca、Sr)修正CVDプロセスによる薄膜。
有機金属化合物を前駆体として使用する場合、このプロセスは一般にMOCVDと呼ばれ、一般的なCVD法であり、薄膜やコーティングを合成するためのSi技術や電子デバイス製造で一般的に使用されます。この手法は、他の物理蒸着プロセスに比べていくつかの潜在的な利点を提供します。たとえば、(i)化学量論、結晶化度、均一性の高度な制御。 (ii)用途の広い組成制御。 (iii)複雑な形状や広い領域をコーティングする機能。処理条件に応じて、さまざまなMOCVDバリアントが利用可能です。たとえば、低圧MOCVD、大気圧MOCVD、直接液体注入MOCVD、プラズマ強化MOCVDです[125]。直接液体注入MOCVDでは、コンピューターによって制御される前駆体溶液の微小液滴が蒸発器システムに注入されます。これらの液滴は、高速電磁弁によって生成されます。注入の頻度と時間は、各堆積材料の適切な成長速度を達成するように適切に調整することができます。したがって、前駆体液体源中の前駆体のそれぞれの濃度を調整することによって、最終的なフィルムの化学量論を正確に制御することができる。これまで、MOCVDは、ペロブスカイトマンガン酸化物薄膜またはLa 1-x などの多層膜の成長に使用されてきました。 Sr x MnO 3 [126]、Pr 1-x Ca x MnO 3 [127]、および(La 0.7 などのペロブスカイト酸化物超格子 Sr 0.3 MnO 3 / SrTiO 3 ) 15 [128]。
分子線エピタキシー
薄膜の分子線エピタキシー(MBE)成長は、原子スプレー塗装と考えることができます。この場合、交互にシャッターを切る元素源を使用して陽イオンの化学量論を正確に制御し、非常に高品質のペロブスカイト酸化物薄膜を生成します。各原子ビームまたは分子ビームからのスプレーの流束は、各種が含まれているエフュージョンセルの温度(したがって蒸気圧)によって制御されます。スプレーの持続時間は、シャッターによってビームごとに個別に制御されます。シャッターは、開放時間(したがって線量)だけでなく、種が成長面に到達する順序も制御します。シャッターと蒸発器の温度(それぞれドーズとフラックスを制御する)を制御することにより、目的の構造のレイヤリングシーケンスをカスタマイズできます。この技術は、原子層レベルまでカスタマイズされた層状制御を備えた層状酸化物を合成するための最高の合成技術です[94]。 Reutler etal。 [129] La 2/3 の成長について報告 Ca 1/3 MnO 3 (001)配向STOおよびNGO単結晶基板上のレーザー分子線エピタキシーによるフィルム。フィルムの厚さは、STOのフィルムで200 nm、NGOのフィルムで40nmでした。 Werner etal。 [130]は、La 0.65 の抵抗対磁場の測定値を報告しました。 Sr 0.35 MnO 3 / SrTiO 3 / La 0.65 Sr 0.35 MnO 3 MBEによって成長したトンネル接合は、低温で非常に高いTMRの大きなフィールドウィンドウを示しました。 Peng etal。 [131] La 0.67 のデッドレイヤーの振る舞いを体系的に研究しました Sr 0.33 MnO 3 (LSMO)/ STOヘテロ構造は、オゾン支援分子線エピタキシー(OMBE)によって成長しました。彼らは、原子ビームの低い運動エネルギーが外因性欠陥を最低レベルに減らすことができ、組成が単一原子層レベルで容易に調整されることを発見しました。 Matou etal。 [132]は、La 0.67 を成長させることによるデッドレイヤーの減少を報告しました。 Sr 0.33 MnO 3 LaMnO 3 で 層、および彼らはLa 0.67 でTMRの検出を示しました Sr 0.33 MnO 3 / LaMnO 3 / La 0.67 Sr 0.33 MnO 3 シャッター付き成長技術を使用してMBEによって成長したヘテロ構造。
平面構造に基づく2D地球ドープペロブスカイトマンガン酸化物ナノ構造
トップダウンメソッド
近年、ナノプレート[133]やラメラ[134]などの平面構造とナノドット[135]またはナノワイヤー[85]の横方向アレイに基づく2Dアースドープペロブスカイトマンガン酸化物ナノ構造が製造されています。電子ビームリソグラフィー(EBL)やNILなどのさまざまな形式の「トップダウン」が、2Dペロブスカイトマンガナイトナノ構造の幾何学的パターン形成に使用されています。
Singh-Bhalla etal。 [136、137]製造(La 0.5 Pr 0.5 ) 0.67 Ca 0.33 MnO 3 フォトリソグラフィーとFIBの組み合わせによる100nmから1μmの範囲の幅のナノブリッジとマイクロブリッジ。彼らは最初に単結晶のエピタキシャル30nm厚(La 0.5 Pr 0.5 ) 0.67 Ca 0.33 MnO 3 NdGaO 3 の映画 (110)PLDによる820°Cでの基板、次にフォトリソグラフィーとFIBの組み合わせを使用して(La 0.5 Pr 0.5 ) 0.67 Ca 0.33 MnO 3 ナノブリッジとマイクロブリッジ。ペーニャ他[138] La 2/3 も製造 Sr 1/3 MnO 3 標準的なフォトリソグラフィー技術によるマイクロブリッジ。 La 0.7 Sr 0.3 MnO 3 寸法が20nm未満のナノブリッジも、対応するエピタキシャル薄膜からFIBによって製造されました[139]。
EBLは、急速に発展しているもう1つのナノファブリケーション技術です。 Guo etal。 [140]成長したLa 0.67 Ca 0.33 MnO 3 PLD技術によってSTO(100)基板上に厚さが約100 nmのフィルムを作成し、La 0.67 を製造しました。 Ca 0.33 MnO 3 EBLテクノロジーによるさまざまな幅(1.5μm、1μm、0.50μmなど)のマイクロブリッジ。ビークマン他[141]も薄くなったLa 0.7 Ca 0.3 MnO 3 DCスパッタリングによるSTO(001)基板上のフィルム(厚さ範囲20〜70 nm)。そして、彼らはLa 0.7 を作りました Ca 0.3 MnO 3 EBLテクノロジーとAr + を使用した幅5μmのマイクロブリッジ エッチング。
ボトムアップメソッド
トップダウン方式に加えて、テンプレート支援合成などのボトムアップ方式も、ナノドットの横方向配列に基づいて2Dペロブスカイトマンガン酸化物ナノ構造を製造するために使用されます。対照的に、テンプレート支援の「ボトムアップ」合成アプローチは、狭いサイズ分布を持つペロブスカイトマンガナイトナノ構造の2D幾何学的秩序を達成するためのルートを提供します。ナノスフェアリソグラフィー(NSL)は、2Dペロブスカイトマンガナイトナノ構造を生成するための多用途のテンプレートベースの方法として実証されています[142]。 NSLでは、周期的に配置されたナノ構造の間隔とサイズは、異なる直径のポリマー球を使用することによって、および/または堆積される材料の量を変更することによって、容易に制御できます。たとえば、Liu etal。 [143] NSLを介して2次元酸化物ナノ収縮アレイを準備しました。彼らは、SiO 2 の水性懸濁液を一滴落としました。 STO(100)基板上の直径1.5μmのミクロスフェア。これらのミクロスフェアは、乾燥プロセス中に自己組織化し、最終的に六角形のような秩序ある単分子層に変化する可能性があります。次に、反応性イオンエッチングプロセスを進めて、ミクロスフェアのサイズを小さくした。続いて、La 0.67 を堆積させるために、基板をPLDチャンバーに入れました。 Sr 0.33 MnO 3 その後、サンプルを炉に移し、750°Cでアニーリングしました。ミクロスフェアを除去した後、La 0.67 Sr 0.33 MnO 3 ナノくびれドットアレイが得られた。低酸素圧下では、La 0.67 Sr 0.33 MnO 3 膜はLa 0.67 の酸素欠乏で堆積されました Sr 0.33 MnO 3 ナノくびれ;サンプルは、空気中で900°Cで8時間さらにアニーリングする必要がありました。最後に、La 0.67 Sr 0.33 MnO 3 ナノくびれドットアレイは、約100nmのサイズで得られました。
3D希土類ドープペロブスカイトマンガン酸化物ナノ構造の合成方法
基本的に、3Dペロブスカイト型酸化物ナノ構造を製造するには、「ボトムアップ」と「トップダウン」の2つのアプローチがあります。 「ボトムアップ」処理とは、原子レベルまたは分子レベルで開始するナノ構造の合成を指します。溶液ベースのルート(例えば、ゾルゲルベースの化学溶液堆積、テンプレート化、液相分解、および水/ソルボサーマル合成)は、3Dペロブスカイト型酸化物ナノ構造を合成するための「ボトムアップ」アプローチで最も一般的に使用されます(すなわち、 、垂直に整列したナノワイヤー、ロッドまたはチューブ)。 「トップダウン」処理、たとえば、FIBフライス盤およびNILなどの一部のリソグラフィー手法は、バルク材料を切り分けて、コヒーレントかつ連続的に秩序化されたナノサイズの構造を作成することで構成されます。最近、3Dペロブスカイトマンガン酸化物ナノ構造が3DナノテンプレートPLD法によって調製されています。この方法の基本的な概念は、3Dナノパターン基板の側面への傾斜した基板堆積です。つまり、3Dナノテンプレートを図1に模式的に示します[144]。最初に、テンプレート壁構造は、有機レジスト(青い領域)を使用したNIL技術によって基板上にパターン化されます(図1a)。次に、ターゲット材料、つまり金属酸化物が、PLDによってテンプレートパターンの側面に堆積されます(図1b)。テンプレートをリフトオフし、残りのボトムフィルムをエッチングした後(図1c、d)、自立型の金属酸化物ナノウォールワイヤアレイが得られます(図1e、f)。直角の側面により、3Dナノテンプレートは形状と位置の基準点として機能します。堆積した材料は、その形状を変換しながら、3Dナノテンプレートの側面(界面)で成長し始めます。したがって、トップダウン方式の解像度の限界を超えたナノ構造の形成が実現されます。最近、正確にサイズ制御された結晶性(La 0.275 Pr 0.35 Ca 0.375 )MnO 3 ナノボックスは、この方法を使用してMgO(001)基板上に製造されました[145]。このプロセス(図2aを参照)では、MgO(001)基板は、最初にNIL技術によって有機レジストキューブでパターン化されました。そして、(La 0.275 Pr 0.35 Ca 0.375 )MnO 3 室温(RT)でレジストキューブの4つの側面にPLD技術によって堆積されました。 (La 0.275 Pr 0.35 Ca 0.375 )MnO 3 ナノボックスは広い領域(〜20mm 2 )で得られました )(La 0.275 Pr 0.35 Ca 0.375 )MnO 3 最上層、および内部コアレジストが削除されました。結晶化度を改善するために、ポストアニーリングプロセスは1Paの酸素圧下で1270Kで実行されました。(La 0.275 の典型的なSEM画像 Pr 0.35 Ca 0.375 )MnO 3 ナノボックスを図2bに示します。図2cに示すように、ナノボックスの壁幅は、堆積時間を変更することにより、160nmから30nmまでの範囲で正常に制御されました。これら(La 0.275 Pr 0.35 Ca 0.375 )MnO 3 ナノボックスは、対応するフィルムよりも高温で絶縁体-金属転移を示しました。これは、適切に整列され、確実に準備された、高度に統合されたCMRマンガナイト3Dナノボックスが、CMR酸化物の物理的特性を調整する方法を提供できることを示しています。 3DナノテンプレートPLD技術を使用して、さまざまなペロブスカイトマンガン酸化物ナノ構造を製造できます。
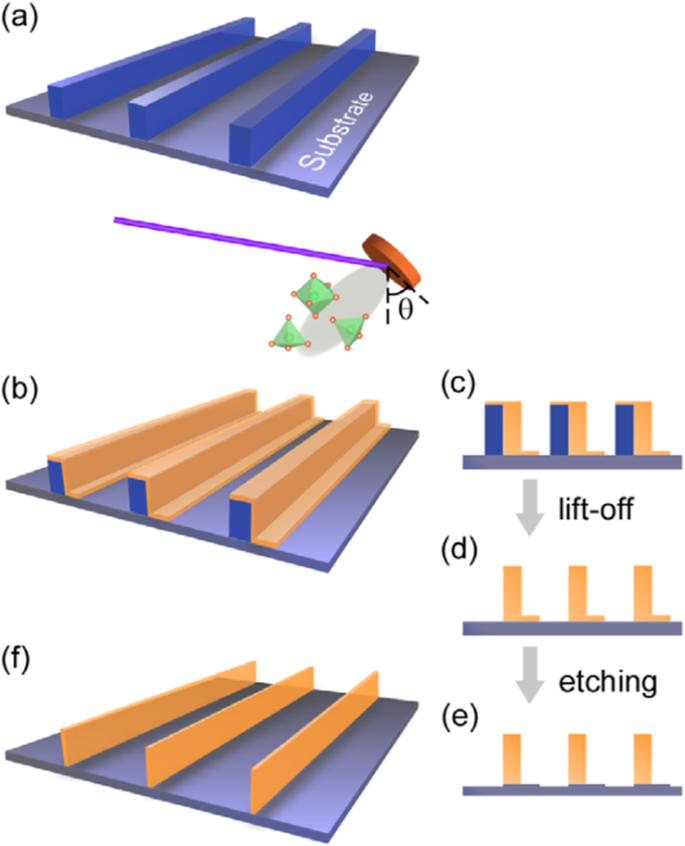
ペロブスカイト酸化物ナノ構造製造のための3DナノテンプレートPLD法の概略フローチャート。 a まず、テンプレートの壁構造が、有機レジスト(青い領域)を使用したNILによって基板上にパターン化されます。 b 次に、機能的なペロブスカイト酸化物(オレンジ色の領域)が、PLDによってテンプレートパターンの側面に堆積されます。 c ( b の断面画像 )。 Cross-sectional images for nanowall-wire structure after d liftoff and e etching. f Finally, self-standing perovskite oxide nanowall-wire arrays are obtained. Reproduced with permission of [144]

a Schematic image for the fabrication procedure of the (La0.275 Pr0.35 Ca0.375 )MnO3 (LPCMO) nanoboxes. b Typical SEM image of (La0.275 Pr0.35 Ca0.375 )MnO3 nanoboxes with 100 nm wall-width and 400 nm height. c The relationship between the wall-width of the (La0.275 Pr0.35 Ca0.375 )MnO3 nanoboxes and the deposition time. Reproduced with permission of [145]
Structural Characterization of Rare Earth-Doped Perovskite Manganite Oxide Nanostructures
Introduction
The structural characterizations of rare earth-doped perovskite manganite oxide nanostructures are conducted to investigate their crystal structures, chemical compositions, and morphologies. The crystal structures are usually characterized by X-ray diffraction (XRD), Raman spectrum, Fourier-transform infrared spectroscopy (FTIR), field-emission scanning electron microscopy (FE-SEM), transmission electron microscopy (TEM), high-resolution TEM (HRTEM), and selected area electron diffraction (SAED). The chemical compositions are usually examined by energy dispersive X-ray spectroscopy (EDS), electronic energy loss spectroscopy (EELS), and X-ray photoelectron spectroscopy (XPS). The chemical bonding and chemical structure of the prepared rare earth-doped perovskite manganite oxide nanostructures can be examined by XPS, EELS, FTIR, and Raman spectra. The morphologies are usually characterized by atomic force microscopy (AFM), scanning electron microscopy (SEM), and TEM. In this section, the structural characterizations of rare earth-doped perovskite manganite oxide nanostructures are described to provide a brief review of the microstructural characterizations of rare earth-doped perovskite manganite oxide nanostructures.
Rare Earth-Doped Perovskite Manganite Oxide Nanoparticles
Up to date, many rare earth-doped perovskite manganite oxide nanoparticles have been synthesized by physical or chemical methods. Their physical and chemical properties are dependent upon the phase structures, morphologies, chemical compositions, and the grain size distributions of the nanoparticles as well as their thermal history during the synthesized process [146]. XRD is often used to identify the phase structure and the relative percents of different phases of the prepared nanomaterials. In addition, some structural parameters such as particle size, lattice parameters (a, b, and c), lattice volume, and theoretical density can be derived from the XRD data. Also, XRD is also used to optimize the preparation conditions of rare earth-doped perovskite manganite oxide nanoparticles [147,148,149]. For example, Sayague’s et al. [147] synthesized the La1-x Sr x MnO3±δ (0 ≤ × ≤ 1) nanoparticles by mechanochemistry synthesis method under different conditions (e.g., different substitutions of La by Sr modifiers; various milling time; heat treatment at 1000 °C under static air), and the XRD patterns of these samples are shown in Fig. 3. Figure 3a shows the XRD patterns of the La1-x Sr x MnO3±δ ( x =0.25) nanoparticles synthesized at different milling time. It was clearly observed that the solid state reaction during mechanochemistry synthesis process progressed significantly after 15 min milling and after 30 min it was almost finished. After only 45 min, no reactant peaks were detected and the solid-state reaction seemed to be complete. To ensure the full conversion, the mechanochemical synthesis of the nanoparticles was then carried out by 60 min ball milling. Figure 3b demonstrates the XRD patterns of the La1-x Sr x MnO3±δ (0 ≤ × ≤ 1) nanoparticles with different substitutions of La by Sr modifiers obtained by mechanochemistry synthesis. All the nanoparticles crystallized in a single phase with pseudo-cubic symmetry and perovskite structure. The right-shift of the XRD reflections in 2θ was ascribed to the substitution of La by Sr modifier. Figure 3c displays the XRD patterns of the La1-x Sr x MnO3±δ (0 ≤ × ≤ 1) nanoparticles heat treated at 1000 °C under static air. Higher crystallinity and well-defined symmetry were clearly observed. Similarly, the XRD reflections are shifted to smaller d-spacing as increasing the La substitution from x =0.0 to x =0.75 (see the inset). In the samples with x =0.0 and x =0.25, the maxima XRD reflections were clearly split demonstrating a structure very similar to La0.95 Mn0.95 O 3 (JCPDS No. 01085-1838) with rhombohedral cell (R3c space group) calculated by Van Roosmalen et al. [150]. However, in the samples with x =0.50, 0.75, 0.80, 0.85, and 0.90, the splitting of the maxima XRD reflections was not observed, which could be ascribed to different symmetries or different lattice parameters and same symmetry. The structural parameters of the synthesized samples in the La1-x Sr x MnO3±δ (0 ≤ × ≤ 1) system were calculated by assuming a rhombohedral symmetry or cubic structure. The results showed a better fit when rhombohedral symmetry (R3c space group) was used for samples with 0 ≤ × ≤ 0.90. However, when the x value is equal to 1.0 (SrMnO3 ), another perovskite structure with hexagonal symmetry and P6 3 /mmc space group (194) was observed. It was found that the volume of the unit cell was decreased as increasing the x value, which was due to the formation of Mn 4+ at the same time that La 3+ (136 pm) is substitute by Sr 2+ (144 pm) in the cationic subcell for keeping electronic neutrality. This is consistent with the ionic radius of Mn 4+ (53 pm) being smaller than that of Mn 3+ (65 pm), and indicates that the manganese ionic radius is actually the determinant of the unit cell volume. Moreover, it is also noticed that the appearance of Mn 4+ ion and its content was increased with increasing the strontium content, will reduce the John–Teller effect that was favored by the Mn 3+ cation. Therefore, the absence of the splitting of XRD peaks when the x values increase can be easily understood due to a higher symmetry of the structure. In order to investigate the changes of the crystallization and symmetry in milled samples (with pseudo-cubic symmetry) after annealing process (rhombohedral symmetry), XRD measurements as a function of the temperature from 30 to 1100 °C (up and down) under air atmosphere were performed. The results are shown in Fig. 4. With increasing the temperature, the crystallization process can be observed and at 1100 °C, a small diffraction peak at 2θ≈35 °C (marked with an asterisk) appear, which could be due to the formation of an orthorhombic phase [151]. As the temperature is lowered down to 800 °C, the small peak still exists and below this temperature it disappears. Below 500 °C, some reflections start to be split (see the inset) and a small peak appears before 2θ =40 °C (marked with a cross), indicating the formation of the rhombohedral phase. The above results demonstrate that the rhombohedral phases are stable at low temperature, which can be explained in terms of oxygen composition. The orthorhombic phase is stable at high temperature (1100 °C) and its ability to accommodate the oxygen in the structure is smaller than that of the rhombohedral one, which stabilizes below 500 °C with an oxygen composition of La0.75 Sr0.25 MnO3.11 。 The average crystallite size (D) was calculated from X-ray line broadening of the (110) diffraction peak using the Scherrer equation, which was about 20 nm close to the data obtained from SEM and TEM images. The preparation conditions (e.g., annealing temperature and time, and synthesis methods) affect greatly the morphology and surface characteristics of rare-earth doped perovskite manganite oxide nanoparticles, as revealed by SEM and TEM [19, 61, 147, 152]. Figure 5 shows the representative SEM images of some milled and heated samples. It was observed that all the milling samples with pseudo-cubic perovskite structure had a similar microstructure characterized by aggregates of small particles. As expected, the heated samples were composed of larger faceted particles, being very similar in shape as can be seen in the H1 and H2 samples with same rhombohedral symmetry; however, the H8 sample with a hexagonal symmetry exhibited very round particles and smaller in size. The representative TEM and SAED results of the milled and heated samples are shown in Fig. 6. The TEM image of M1 sample (x =0.0) (shown in Fig. 6a) had quite large particles formed in fact by agglomerated small crystallites in the nanometer size range as evidenced by the presence of rings in the SAED pattern. All the rings can be indexed in the pseudo-cubic structure (Pm -3m )。 TEM images of the H1 sample (Fig. 6b) and the H3 sample (Fig. 6c) also showed the presence of aggregates but formed by sub-micrometric crystallites of several hundred nanometers as observed in the enlargements of two of these crystals. The corresponding SAED patterns were taken along the [001], [211], and [210] zone axis. All the diffraction spots can be indexed in the rhombohedral structure (R -3c )。 The TEM image of the H8 sample (x =1.0) shown in Fig. 6d displays the crystals with different sizes, and its SAED pattern taken from the [201] zone axe can be indexed in the hexagonal structure (P6 3 /mmc ), matching well with the XRD data. Tian etal。 [20] also synthesized a series of crystalline La1-x Sr x MnO 3 nanoparticles with an average particle size of ~ 20 nm and good dispersion by MSS method. These La1-x Sr x MnO 3 nanoparticles are well dispersed in water to form a clear solution and do not deposit even after standing for several weeks, exhibiting a good dispersion.

a XRD patterns of the La1-x Sr x MnO3±δ ( x =0.25) nanoparticles synthesized by mechanochemistry method under different milling time. b XRD patterns of the La1-x Sr x MnO3±δ (0 ≤ × ≤ 1) nanoparticles with different substitutions of La by Sr modifiers. c XRD patterns of the La1-x Sr x MnO3±δ (0 ≤ × ≤ 1) nanoparticles heat treated at 1000 o C under static air. (i) x =0, 0.25, 0.50, and 0.75, and (ii) x =0.80, 0.85, 0.90, and 1.0. The inset shows an enlargement of the highest maxima. Reproduced with permission of [147]

Thermal evolution of the XRD patterns of the La0.75 Sr0.25 MnO3±δ sample as a function of the temperature from 30 to 1100 °C (up and down) performed under air atmosphere. The inset shows an enlargement of the highest maxima. Reproduced with permission of [147]

SEM images of the corresponding to samples M1 and H1 (x =0), M2 and H2 (x =0.25), and M8 and H8 (x =1.0). The samples in the La1-x Sr x MnO3±δ (0 ≤ × ≤ 1) system with the first step after milling refer to M samples and after heated at 1100 °C under air atmosphere during 12 h refer to H samples. Reproduced with permission of [147]

TEM images and SAED patterns corresponding to a M1 (x =0), b H1 (x =0), c H3 (x =0.50), and d H8 (x =1.0) samples. The samples in the La1-x Sr x MnO3±δ (0 ≤ × ≤ 1) system with the first step after milling refer to M samples and after heated at 1100 °C under air atmosphere during 12 h refer to H samples. Reproduced with permission of [147]
The chemical bonding and structural information of the rare earth-doped perovskite manganite oxide nanoparticles can be revealed via FTIR and Raman spectra. For example, the main absorption band around 524 cm −1 observed in the FTIR spectra of the La0.7 Sr 0.3 MnO 3 nanoparticles synthesized by a modified sol-gel route can be ascribed to the stretching vibration mode of the metal-oxygen bond in the perovskite, which involves the internal motion of a change in Mn–O–Mn bond length in MnO6 octahedral [153]. The strong absorption peak around 1381 cm −1 in La0.7 Sr 0.3 MnO 3 particles (annealed at 500 °C) reveals that the stretching vibration of carbonyl group (COO–) in carbonate, which diminishes with increasing calcination temperature. The La0.7 Sr 0.3 MnO 3 particles annealed at 800 °C have a doublet in the main absorption band around 520 cm −1 , which should belong to stretching (3ν) and bending (4ν) modes of the internal phonon modes of MnO6 octahedral. The stretching mode is related to the change of Mn–O–Mn bond length and the bending mode involves the change of Mn–O–Mn bond angle. The appearance of the stretching and bending modes at transmission spectra indicates that the perovskite structure of LSMO has been formed. In the Raman spectra of Pr-doped La0.67 Ca 0.33 MnO 3 nanoparticles synthesized via sol-gel route, three Raman peaks around 224 cm −1 , 425 cm −1 , and 680 cm −1 are observed, respectively [39]. The Raman peak around 224 cm −1 can be assigned as Ag (2), which is related to the tilting of MnO6 octahedron, whereas the Raman peak around 425 cm −1 is related to the Jahn-Teller type modes of the MnO6 octahedron [154]. The Raman peak around 680 cm −1 can be assigned as B2g (1), which is related to the symmetric stretching vibration mode of oxygen in MnO6 octahedron [154]. With increasing the Pr-doping concentration (x ) up to x =0.4, the Raman peak around 680 cm −1 became disappeared. That was ascribed to the increased orthorhombic distortion in the LPCMO nanoparticles with high Pr-doping concentrations, leading to the much weak symmetric stretching vibration of oxygen in MnO6 octahedron [39].
XPS is a surface-sensitive technique, which provides the information of the surface elemental compositions and surface chemistry of a material. The surface compositions of rare earth-doped perovskite manganite oxide nanoparticles can be identified via XPS [21, 39, 154]. For example, Fig. 7 shows the Mn 2p3/2 and O 1s XPS spectra of LaMnO3.15 (LMO) and La0.67 Sr 0.33 MnO 2.91 (LSMO) nanoparticles synthesized by MSS method, which are effective catalysts for volatile organic compounds combustion [21]. It is observed in Fig. 7a that, for each sample, an asymmetrical Mn 2p3/2 peak located at 642.2 eV could be resolved into two components with a binding energy of 641.5 eV and 642.9 eV, respectively. The former component can be assigned to the Mn 3+ ions, whereas the latter one is assigned to the Mn 4+ ions, indicating that the dual (Mn 4+ and Mn 3+ ) ions coexist in both samples. Quantitative analysis of the molar ratio of Mn 4+ to Mn 3+ on the surface of LaMnO3.15 was 0.72, while that of La0.67 Sr 0.33 MnO 2.91 was 1.33. That is to say, the average oxidation states of manganese were 3.42 and 3.57 on the surface of LaMnO3.15 and La0.67 Sr 0.33 MnO 2.91 samples, respectively. In addition, it is also noticed that the peak area of Mn 4+ ion in the La0.67 Sr 0.33 MnO 2.91 sample is 35% more than that of Mn 3+ , whereas the peak area of Mn 4+ in the LaMnO3.15 sample is less than that of Mn 3+ 。 It can be concluded that the Sr enrichment on the surface makes the Mn 3+ ion on the surface of La0.67 Sr 0.33 MnO 2.91 easy to be oxidized, increasing the surface concentration of Mn 4+ 。 As demonstrated in Fig. 7b, the O 1s XPS peak could be decomposed into three components at binding energy (BE) equal to 529.5, 531.6, and 533.2 eV, which were ascribed to the surface lattice oxygen (Oα ), adsorbed oxygen (Oβ , such as O − , O 2− , or \( {\mathrm{O}}_2^{2-} \)), and hydrated oxide species (Oγ ), respectively [155, 156]. Obviously, after the partial substitution of Sr 2+ for La 3+ , the intensities of the signals of Oα and Oγ were decreased whereas the signal for Oβ was increased, indicating an enhancement in the amount of adsorbed oxygen species. Therefore, more structural defects such as oxygen vacancies contribute to the enhanced catalytic performance of the La0.67 Sr 0.33 MnO 2.91 nanoparticles for toluene combustion.

a Mn 2p3/2 and b O 1s XPS spectra of LaMnO3.15 (LMO) and La0.67 Sr 0.33 MnO 2.91 (LSMO) nanoparticles. Reproduced with permission of [21]
1D Rare Earth-Doped Perovskite Manganite Oxide Nanostructures
The exciting developments in 1D perovskite manganite nanostructures must be effectively supported by a variety of structural characterization tools because the characterization provides invaluable information on the various microstructural, crystallographic, and atomic features, which can shed light on the unique properties exhibited by these fascinating materials. XRD is used for crystal structure analysis in which some structural parameters can be obtained. For example, Arabi et al. [80] synthesized the La0.7 Ca 0.3 MnO 3 nanorods by hydrothermal method under different conditions (e.g., different mineralization agents such as KOH and NaOH, various alkalinity conditions (10, 15, and 20 M)). Figure 8a shows the XRD patterns of the La0.7 Ca 0.3 MnO 3 nanorods synthesized in the presence of two different mineralization agents (KOH and NaOH) with various concentration, namely K10, K15, K20, N10, N15, and N20, respectively. It was found that all the six samples crystallized in orthorhombic structure with space group Pnma according to the diffraction peaks. A typical Rietveld refinement analysis of the sample N10 is displayed in Fig. 8b, indicating a good agreement between the observed and calculated profiles and no detectable secondary phase present. The FE-SEM micrographs confirmed the rod-like morphology of all the obtained samples.

a Room temperature XRD patterns of La0.7 Ca 0.3 MnO 3 manganite nanorods synthesized via the hydrothermal method with two mineralizers namely sodium hydroxide (NaOH) and potassium hydroxide (KOH) in different alkalinity conditions (10, 15, and 20 M). b Room temperature XRD pattern (red symbol) and Rietveld profile (black line) for the sample N10. N (or K) means the NaOH (or KOH) mineralizer, 10 for the NaOH (or KOH) concentration. Reproduced with permission of [80]
Datta etal。 [70] reported the template free synthesis of single-crystalline La0.5 Sr 0.5 MnO 3 nanowires by hydrothermal method. XRD pattern (see inset in Fig. 9a) demonstrated that these nanowires crystallized in a tetragonal structure with the space group I 4/mcm 。 The diameter and length of these nanowires were about 20–50 nm and 1–10 μm, as revealed by SEM image (Fig. 9a) and TEM image of a single nanowire (Fig. 9b). Single-crystalline nature of the nanowires was confirmed by the SAED pattern and HRTEM image (see insets in Fig. 9b). The lattice fringes with spacing of 0.311 nm were clearly resolved in the HRTEM image, corresponding the planar distance of (102) planes. The EDS data collected from the nanowire demonstrated that the atomic percentage ratio (La:Sr):Mn:O was approximately 1:1:3, close to the desired composition. The valence state of Mn in the nanowires was also quantitatively determined by EELS, which was about 3.5, very close to its bulk value. Similar work was also carried out to determine the Mn valence in the La0.7 Ca 0.3 MnO 3 、La 0.5 Ca 0.5 MnO 3 , and La0.7 Sr 0.3 MnO 3 nanowires synthesized by hydrothermal method [157]. In addition, single-crystalline perovskite manganite La0.5 Ba 0.5 MnO 3 and La0.5 Sr 0.5 MnO 3 nanowires were also synthesized by a hydrothermal method at low temperature [158]. They have a uniform width along the entire length, and their typical widths are in the range of 30–150 nm for La0.5 Ba 0.5 MnO 3 and 50–400 nm for La0.5 Sr 0.5 MnO 3 。 These nanowires grow along the [110] direction and their surfaces are clean without any sheathed amorphous phase. By the composite-hydroxide-mediated method, Wang et al. [159] synthesized the BaMnO3 nanorods with diameters of 20–50 nm and lengths of 150–250 nm, which belong to a hexagonal structure with lattice parameters of a =0.5699 nm and c =0.4817 nm. By template-assisted method, Li et al. [160] also synthesized the La0.33 Pr0.34 Ca 0.33 MnO 3 /MgO core-shell nanowires with diameters about tens of nanometers in two steps.

a SEMおよび b TEM images of the La0.5 Sr 0.5 MnO 3 (LSMO) nanowires synthesized by hydrothermal method. Inset in (a ) is the XRD pattern of the LSMO nanowires, confirming the phase formation and phase purity. Insets in (b ) are the selected area diffraction pattern and HRTEM image taken from a single LSMO nanowire, revealing the single crystalline nature of the LSMO nanowire. Reproduced with permission of [70]
Similarly, by using AAO membranes (pore size ~ 300 nm, thickness ~ 100 mm) as the templates, perovskite manganite La0.75 Ca0.25 MnO 3 nanotubes with the average diameter of 160 nm and lengths up to tens of micrometers were fabricated by laser induced plasma filling [161]. The XRD pattern of the synthesized La0.75 Ca0.25 MnO 3 nanotubes is shown in Fig. 10a, where all the diffraction peaks can be indexed perfectly to the standard monoclinic perovskite structure of bulk La0.8 Ca0.2 MnO 3 (JCPDS no. 44-1040), and no second phase was detectable. That indicated well-crystallized perovskite-type phase was successfully transferred from the target to the nanotubes via the PLD method. The composition of the as-prepared La0.75 Ca0.25 MnO 3 nanotubes was determined by EDS analysis technique, and the result matches well with the target. A representative SEM image of the La0.75 Ca0.25 MnO 3 nanotubes array is shown in Fig. 10b, which reveals uniform fluffy feature with an average length of 50 μm. The cross-sectional TEM image of the La0.75 Ca0.25 MnO 3 nanotubes is shown in Fig. 10c, where the maximum wall thickness was observed about 20 nm. This thin-walled feature determines the poor mechanical strength of the nanotubes, hence the ultrasonic processing was avoided during the nanotubes dispersion. This indicates that the length of the nanotubes can be controlled by the amount of deposition from several to tens of micrometers. It is also noticed that a nanowire-like structure with the diameter of ca. 10 nm is observed in TEM image (Fig. 10d), which may originate from either the broken walls of nanotubes or the curl of nanotubes during the annealing process. The uniformly distribution of the elements in the wall of individual nanotube was also confirmed by EDS element mapping.

a XRD pattern of La0.75 Ca0.25 MnO 3 (LCMO) nanotubes (NTs) prepared by template-assisted PLD method and its corresponding peak positions and intensity in JCPDS card no. 44-1040 of La0.8 Ca0.2 MnO 3 。 b SEM image of the as-prepared LCMO nanotubes, and c cross-sectional TEM image of the LCMO nanotubes. d TEM images of the as-prepared LCMO nanotubes. Inset in (c ) is enlarged local TEM image of nanotube, revealing the maximum observed wall thickness of about 20 nm. Reproduced with permission of [161]
2D Rare Earth-Doped Perovskite Manganite Oxide Nanostructures
Perovskite manganite oxides have been a particularly appealing hunting ground for both condensed matter physics and practical device applications due to their physical properties, such as the high degree of spin polarization, CMR, spontaneous charge spin–orbital orderings, and so on [13, 162,163,164,165,166]. In thin films of rare earth perovskite manganites, RE1-x Mx MnO 3 (RE =rare earth, M =Ca, Sr, Ba) with mixed-valence perovskite structure, their transport properties are highly dependent upon the deposition techniques, processing conditions, and the substrate used. Among all perovskite manganite thin films, La1-x Sr x MnO 3 has been the most widely investigated system due to its intrinsic magnetoresistance properties, electric-field tunable M-I transitions, half-metallic band structure, and the highest Currie temperature (Tc =369 K for x =0.33). Up to date, several deposition methods have used for their growth. For example, PLD and CVD are versatile techniques that can be used both for the growth of epitaxial and polycrystalline films [167, 168], and RF magnetron sputtering and wet chemical processes are principally for polycrystalline films [169,170,171,172]. In contrast, MBE and atomic layer deposition (ALD) are mainly used for epitaxial films and superlattice structures. For example, polycrystalline perovskite manganite La1-x Sr x MnO 3 films with x =0.15, 0.33, and 0.40 were deposited onto silicon (100) substrates by PLD in an 80/20 (Ar/O2 ) atmosphere at room temperature [173]. After deposition, the films were air annealed at 900 °C for 1 h to obtain the desired crystalline phase. Several groups have epitaxially grown the La0.67 Sr 0.33 MnO 3 thin films on different single-crystal substrates including STO (cubic), LAO (pseudocubic), NGO (orthorhombic), and MgO (cubic) [174,175,176,177]. Due to the small lattice mismatch between the La0.67 Sr 0.33 MnO 3 and these substrates (except for MgO), the La0.67 Sr 0.33 MnO 3 films exhibit single crystalline in a perfect epitaxy between the film and the substrate. Therefore, neither interfacial dislocations nor secondary phases’ inclusions are observed at the film/substrate interface, as it can be further identified by the cross-sectional HRTEM image [176]. Since the lattice strain is not released easily, therefore, the La0.67 Sr 0.33 MnO 3 films (4–60 nm) exhibit a strong perpendicular magnetic anisotropy on LAO substrate due to the biaxial compressive strain. On the other hand, the La0.67 Sr 0.33 MnO 3 films show the in-plane biaxial magnetic anisotropy on STO substrate by the tensile strain. The MnO6 octahedra of the strained La0.67 Sr 0.33 MnO 3 films are distorted and the hopping probabilities of eg electrons are restricted. Localization of eg electrons reduces the ferromagnetic interactions, enhancing the electrical resistivity of the La0.67 Sr 0.33 MnO 3 薄膜。 As for the films thicker than 60 nm, different microstructures are reported. For example, the films are still single crystalline without dislocations or intermediate layer in the whole thickness up to 120–130 nm [176, 178] or the films are divided into two regions with a strained bottom part and a relaxed top layer that are separated by an intrinsic interface containing a dislocation network [179]. These microstructures can be ascribed to strongly different growth parameters such as deposited temperature, the target-to-substrate distance, and oxygen pressure, laser influence. To make the full use of functionalities of the epitaxial La0.67 Sr 0.33 MnO 3 thin films into the future devices such as sensors, data storage media, and IR detectors, the integration of the functional oxides into conventional semiconductor substrates is highly essential [180, 181]. However, the direct epitaxial growth of La0.67 Sr 0.33 MnO 3 thin films and functional complex oxides on the Si substrates needs to be further developed due to the dissimilarities of these materials in chemical reactivity, structural parameters, and thermal stability [182]. Vila-Fungueiriño et al. [183] reported the high-quality epitaxial growth of the La0.67 Sr 0.33 MnO 3 thin films on Si substrates with epitaxial STO thin buffer layer by a combination of CSD and MBE methods. Figure 11 displays the STEM image of atomic and chemical structure of the epitaxial La0.67 Sr 0.33 MnO 3 (LSMOPAD )/STOMBE /Si heterostructure. Atomic-resolution Z-contrast images of the LSMO/STO/Si interface confirm an optimal epitaxial growth of LSMO ultra-thin films with a perfect crystalline coherence onto the STO/Si buffer layer. EELS measurements with atomic resolution (Figure 11 right) show that cationic intermixing is restricted to the first two unit cells, in agreement with the sharp contrast observed in the Z-contrast image.

Atomic resolution Z-contrast image of epitaxial La0.7 Sr 0.3 MnO 3 (LSMO)PAD /SrTiO3 (STO)MBE /Si heterostructure viewed along the [100] direction. Detail of the Z-contrast image showing the coherent interface between the LSMO and the STO/Si buffer layers (left image). EELS image (right):color elemental mapping produced by overlaying the Mn L2,3 (green), Ti L2,3 (blue), Sr M4,5 (red), and La M4,5 (orange) elemental maps, displaying a high-quality chemical interface between the STO and LSMO layer, the structure of which is sketched in the left of the image, respectively. Reproduced with permission of [183]
To modulate the magnetic and transport properties of epitaxial La1-x Sr x MnO 3 thin films, superlattice structures such as (LSMO/STO)n were grown on LAO substrates by MOCVD [184]. The XRD pattern (synchrotron) of the (LSMO/STO)n superlattice is shown in Fig. 12a, which demonstrates well-resolved satellite peaks characteristic of the superlattice period. That indicates a good coherence over the stacking. Figure 12b shows a cross-sectional HRTEM image of the (LSMO/STO)n superlattice, revealing sharp interfaces between individual layers. The perfect interfaces between adjacent layers extend on a very large scale. It is observed that the Tc value is decreased sharply when the thickness of the LSMO layer is decreased below 4 nm (see Fig. 12c) [163]. The dependence of Tc as a function of the LSMO thickness can be understood from the 2D scaling law proposed by Fisher and Barber [185], which gives a typical two-dimensional thickness of about four monolayers (t 2D ∼1. 5–2 nm). Besides the (LSMO/STO)n superlattice, the (La0.7 Sr 0.3 MnO 3 (LSMO))m /(SrRu1-x Tix O 3 (SRTO))n ( x <0.3) superlattices was also reported by Xu et al. [108]. For clarity, the sample is written as [m / n ]N (the numbers of m および n in square brackets denote the thicknesses of LSMO and SRTO in nanometers, respectively, and the subscript N denotes the periods, i.e., the repeat numbers of LSMO). Figure 13 shows a STEM image of the [1.2/2.4]10 sample grown on NGO substrates, indicating the high quality of superlattices grown on NGO.

a XRD pattern (synchrotron) of the [(La0.7 Sr 0.3 MnO 3 )5 (SrTiO3 )8 ]15 superlattice. b Cross-sectional HRTEM image of the [(La0.7 Sr 0.3 MnO 3 )5 (SrTiO3 )8 ]15 superlattice. Reproduced with permissio n[184]. Copyright 2018, Taylor &Francis Group. c Dependence of Curie temperature (Tc) as a function of the thickness of the LSMO layer in [(La0.7 Sr 0.3 MnO 3 )m (SrTiO3 )8 ]15 superlattices grown by MOCVD. Reproduced with permission of [163]

STEM image of the cross-sectional elemental mapping measured by spatially resolved electron energy loss spectroscopy for the La0.7 Sr 0.3 MnO 3 /SrRu0.8 Ti0.2 O 3 superlattice of [1.2/2.4]10 , grown on NdGaO3 (NGO)(001). The sample written as [m/n]N , where the numbers of m and n in square brackets denoting the thicknesses of the LSMO and SRTO layers in nanometers, respectively, and the subscript N representing the repeated number of LSMO layers. Reproduced with permission of [108]
The 2D morphology of perovskite manganite nanosheets have the advantage of direct implementation as potential building blocks for next-generation nanodevices due to their extended 2D network with rich electronic and magnetic properties. Recently, Sadhu and Bhattacharyya [186] synthesized pure-phase perovskite Pr0.7 Ca 0.3 MnO 3 manganite nanosheets (PNS1) and Pr0.51 Ca0.49 MnO 3 manganite nanosheets (PNS2) via a “beakerless” pressure synthesis route. XRD Rietveld refinement patterns revealed that the PNS1 and PNS2 perovskite manganite nanosheets crystallized in the orthorhombic phase with the Pnma space group. The TEM image of four stacked sheets (i–iv) of the representative PNS1 sample is shown in Fig. 14a, and the SAED pattern is shown as inset in Fig. 14a, indicating the characteristic reflections of the orthorhombic phase. Lattice fringes with spacing of 0.272 nm are observed in the HRTEM image (Fig. 14b), corresponding to the (112) plane reflection. Figure 14(c) displays the FE-SEM image of PNS1 nanosheets with thickness of 10–14 nm. In addition, the nanosheet surface spans over 500–600 nm, and on average 10–12 nanosheets remain stacked together. EDS data on ten different nanosheets provided the homogeneity profile of the samples (Fig. 14d, e). The nanosheet morphology (Fig. 14f), lattice fringes with FFT (Fig. 14g), and the EDS pattern (Fig. 14h) of the PNS2 samples were found similar to that for PNS1. The EDS results matched well with that of ICP-MS as Ca 2+ /Pr 3+ atomic ratio which was 30.0 ± 0.5 for PNS1 and 49.0 ± 0.5 atom % for PNS2, respectively.

a TEM image of Pr0.7 Ca 0.3 MnO 3 nanosheet (PNS-1 sample). i–iv represent four stacked nanosheets. Inset is the SAED pattern. b HRTEM image of two nanosheets oriented in different directions. c FE-SEM image of PNS-1. Arrows indicate the thickness of the nanosheet. d EDAX pattern of PNS-1. e Homogeneity profile of Ca 2+ doping on ten nanosheets in PNS1 and PNS2 samples. f FE-SEM, g TEM (inset:FFT), and h EDAX pattern of Pr0.51 Ca0.49 MnO 3 nanosheet (PNS-2 sample). Reproduced with permission of [186]
2D rare earth-doped perovskite manganite oxide nanostructures such as La0.67 Ca 0.33 MnO 3 nanobridges are also fabricated by FIB method from the epitaxial La0.67 Ca 0.33 MnO 3 thin films [187]. Figure 15 shows schematic diagrams for the fabrication process of La0.67 Ca 0.33 MnO 3 nanobridges, which involves epitaxial growth of La0.67 Ca 0.33 MnO 3 film by PLD method or MOCVD, nanobridge fabrication by FIB (or EBL), and four-electrode construction for physical measurement. For physical property measurements, the electric connection between the sample and instrument can be achieved in different ways such as wire bonding, indium and silver paint [188].

Schematic diagram for fabrication process of the La0.67 Ca 0.33 MnO 3 (LCMO) nanobridges. a Substrate, b LCMO film deposition, c nanobridge fabrication by FIB, and d four-electrode test configure. Reproduced with permission of [187]
3D Rare Earth-Doped Perovskite Manganite Oxide Nanostructures
Generally, 3D nanostructures can be fabricated via “top-down” and “bottom-up” approaches. For example, well-defined 3D epitaxial perovskite manganite oxide nanowall wires are prepared by using a unique nanofabrication technique combining of top-down nanolithography and bottom-up epitaxial thin-film growth [189,190,191]. A schematic diagram for growing such 3D nanostructures is shown in Fig. 16a, where (La0.275 Pr0.35 Ca0.375 )MnO3 is deposited onto the side-surface of 3D MgO using inclined PLD [192]. Figure 16b demonstrates a SEM image of (La0.275 Pr0.35 Ca0.375 )MnO3 nanowall wires with 50 nm width on a MgO(001) single crystal substrate, where well-defined (La0.275 Pr0.35 Ca0.375 )MnO3 nanowall wires with homogeneous lateral interfaces between each nanowire and the side-surface of the 3D-MgO nanotemplate, are realized. A single (La0.275 Pr0.35 Ca0.375 )MnO3 nano-wall wire bridging two electrodes fabricated as a two probe device using photolithography is shown in Fig. 16c. The realization of nanowall-wire samples of strongly correlated perovskite manganite materials enables ones to capture single electronic domains when the width of the nanowall-wire approaching to a single electronic domain and to identify their M–I transition characteristics at the single domain scale. In addition, (La0.275 Pr0.35 Ca0.375 )MnO3 nanowall-box are also grown by the same method [145].

a Concept of an original nanofabrication technique, 3D nanotemplate PLD, where (La0.275 Pr0.35 Ca0.375 )MnO3 (LPCMO) is deposited onto the side-surface of 3D MgO using inclined PLD. b SEM image of the LPCMO nanowires with 50 nm width on a MgO (001) single crystal substrate. c Top-view SEM image of an LPCMO nanowire structure bridging electrodes with a 2 μm gap. Reproduced with permission of [192]
3D nanostructured perovskite manganite materials such as branched nanorods or nanoforests have attracted extensive research attentions due to their unique 3D nature. By making full use of the vertical and horizontal dimensions, perovskite manganite oxide 3D nanostructures exhibit many fascinating physical and chemical properties due to their highly enhanced interfacial area and stability, as compared to the one-dimensional (1D) nanowire arrays [193,194,195,196,197]. Recently, 3D nanostructures have been successfully constructed by interlayering La0.67 Ca 0.33 MnO 3 (LCMO)–CeO2 -based epitaxial vertically aligned nanocomposite thin films with pure CeO2 (or LSMO) layers, which were epitaxial grown on SrTiO3 (001) substrates via a PLD method [198]. This 3D strained framework structures combine both the lateral strain by the layered structures and the vertical strain in the vertically aligned nanocomposite and thus achieve the maximized strain tuning in LSMO. The schematic diagram illustrating the design of such 3D nanostructures is shown in Fig. 17, which creates 3D interconnected CeO2 or LSMO framework microstructures within the thin films, and provides versatile tool to achieve 3D strain tuning. The structural characterizations of this 3D nanostructures are shown in Fig. 18 [198]. Clearly, the CeO2 nanopillars with a large aspect ratio are vertically aligned and well distributed in the LSMO matrix and the sharp phase boundaries suggest the well separated growth of the two phases. Thus, a well-defined 3D interconnected LSMO frame is clearly achieved within the dense films. More importantly, by varying the types of the interlayers (e.g., CeO2 or LSMO) and the number of interlayers from 1 to 3 layers, such 3D framework nanostructures effectively tune the electrical transport properties of LSMO, e.g., from a 3D insulating CeO2 framework with integrated magnetic tunnel junction structures, to a 3D conducting LSMO framework, where the MR peak values have been tuned systematically to a record high of 66% at 56 K and enhanced MR properties at temperatures above room temperature (~ 325 K). This new 3D-framed design provides a novel approach in maximizing film strain, enhancing strain-driven functionalities, and manipulating the electrical transport properties effectively.

Schematic illustration of 2-phase heterogeneous microstructure evolution of the thin films:from vertical aligned nanocomposite (VAN) C0/L0 to 3D CeO2 framed thin films C1–C3 and 3D La0.7 Sr 0.3 MnO 3 (LSMO) framed thin films L1–L3. The 3D framed microstructure is achieved by alternative growth of the single phase and the VANs in multilayered fashion. This design combines the lateral strain introduced from multilayered thin film and the vertical strain from interfacial coupling in VANs, creates 3D interconnected CeO2 or LSMO framework microstructures within the thin films, and provides a versatile tool to achieve 3D strain tuning. The unit cells and phase of LSMO are in green, and the unit cells and phase of CeO2 are in red. The single layer LSMO–CeO2 VAN thin films are named as C0 or L0, without LSMO or CeO2 as the interlayers. 3D CeO2 interlayered thin films with 1, 2, and 3 interlayers inserted in VAN structures are named as samples C1, C2, and C3, respectively. Similarly, 3D LSMO interlayered thin films with 1, 2, and 3 interlayers inserted in VAN are named as sample L1, L2, and L3, respectively. Reproduced with permission of [198]

a Cross-sectional TEM image of the VAN thin film C0 and b its corresponding STEM image at low magnification. c Cross-sectional and d plan-view HRTEM images of sample C0. In the HRTEM image of (c ), “C” in yellow points out the CeO2 nanopillars and “L” in green points out the La0.7 Sr 0.3 MnO 3 (LSMO) matrix. Clearly, those CeO2 nanopillars with a large aspect ratio are vertically aligned and well distributed in the LSMO matrix and the sharp phase boundaries suggest the well separated growth of the two phases. Cross-sectional TEM images of the thin films e – g C1–C3 and h –j L1–L3, showing the microstructures of 3D interconnected CeO2 and LSMO frames embedded within the thin films respectively. Reproduced with permission of [198]
Physical Properties of Rare Earth-Doped Perovskite Manganite Oxide Nanostructures
Rare Earth-Doped Perovskite Manganite Oxide Nanoparticles
Magnetic Properties
Superconducting quantum interference device (SQUID) magnetometer is the most powerful, sensitive, and widely used instrument for magnetic characterization in material science. This device works on the principal of quantum interference produced using Josephson junctions. This measurement system is used for d.c. magnetization and M vs. H measurements of the samples. For d.c. magnetization, a small external field is applied and χ is measured as a function of temperature at constant applied field. For M-H measurements, magnetization is measured at a constant temperature while magnetic field is varied up to a certain value of positive and negative applied field. The most common units for the magnetic moment is emu. The natural unit of the magnetization is thus emu/g or emu/cm 3 。 If one can estimate the number of atom in the sample, then one can also calculated the magnetic moment per atom in μB 。
The perovskite manganite oxide nanoparticles of La1-x Sr x MnO 3 are one of the most attractive rare earth-doped perovskite manganites, which exhibit a metallic nature, large bandwidth, and the Curie temperature (T C ) as high as 300–370 K [199]. Their magnetic properties are influenced by many factors; the key ones include chemical compositions, the type and the degree of defectiveness of the crystal lattice, the particle size and morphology, the interactions between the particle, and the surrounding matrix and/or the neighboring particles. By changing the nanoparticle size, shape, composition ,and structure, one can control to an extent the magnetic characteristics of the nanoparticles. For example, Baaziz et al. [148] synthesized La0.9 Sr0.1 MnO 3 nanoparticles by the citrate-gel method and annealed them at 600 °C (H6), 800 °C (H8), 1000 °C (H10), and 1200 °C (H12), respectively. Their magnetization (M) versus temperature (T) curves measured under the applied magnetic field of 500 Oe are shown in Fig. 19a. T C was obtained from the inflection points in dM/dT as a function of temperature for all samples in the inset (Fig. 19i)). As shown in M–T curve, all samples exhibit a PM to FM transition at T C upon cooling. T C dependent upon the particle sizes (d ) is shown as an inset (Fig. 19ii) in Fig. 19a, where it is clearly observed that T C decreases from 250 to 210 K with increasing the particle size from 45 to 95 nm. The decrease of the Curie temperature with increasing the particle size can be ascribed to the strain effects of grains induced by the distortion at grain boundaries and the orthorhombic strains caused by the strong J–T coupling. It was also found that the saturation magnetizations (Msat ) of the La0.9 Sr0.1 MnO 3 nanoparticles were increased with increasing the particle sizes, as shown in Fig. 19b. The reduction of Msat in the small particles may be attributed to the loss of long-range ferromagnetic (FM) order in the smaller particle sized samples since the surface contribution is larger in this case. This can be explained in terms of a core-shell model developed for nanoparticles [58, 200, 201], where ideally the core part retains the bulk-like physical properties, but the outer shell (with thickness t ) can be considered as a disordered magnetic system whose magnetization may be considered to be zero in the absence of the magnetic field (see the inset of Fig. 19b). This shell is named as the dead layer, which does not have any spontaneous magnetization. As the particle size decreases, the shell thickness t increases, which enhances the inter-core separation between two neighboring particles, resulting in a decrease in the magnetic exchange energy. That is the reason why the reduction in the saturation magnetization with decreasing the particle size. In order to confirm this, Msat value versus the inverse of the crystallite sizes (1/d ) is plotted in Fig. 19b, which reveals a quasi-linear relationship between the Msat and 1/d 。 Similarly, the particle size effect on the magnetic properties of La0.8 Sr 0.2 MnO 3 nanoparticles synthesized by the microwave irradiation process was also observed [64].

a Temperature dependence of magnetization in the La0.9 Sr0.1 MnO 3 サンプル。 Insets:(i) the dM/dT vs. T plots, and (ii) dependence of TC on the average of grain size (d )。 b Saturation magnetization Msat values versus the inverse of the crystallite sizes (1/d )。 Insert in (b ) is a schematic diagram of the core-shell model for ferromagnetic nanoparticle. Reproduced with permission [148]. Copyright 2014, Elsevier Ltd and Techna Group S.r.l
Beside the particle size and the synthesis process, the magnetic properties of La1-x Sr x MnO 3 nanoparticles are also dependent upon the Sr-doping level. Tian etal。 [20] synthesized La1-x Sr x MnO 3 ( x =0, 0.3, 0.5, 0.7) nanoparticles by a facile molten salt synthetic route. Their magnetic properties were modified by the Sr-doping levels. The Curie temperatures (Tc) deduced from the magnetization (M )-temperature (T ) curves were 208, 252, 257, and 275K for x =0, 0.3, 0.5, and 0.7, indicating that the Tc values were increased with the Sr-doping levels. Recently, Xia et al. [39] synthesized (La1-x Prx )0.67 Ca 0.33 MnO 3 (LPCMO, x =0.0–0.5) nanoparticles via sol-gel process. Their T C values were measured to be 233, 228, 180, and 171 K for the LPCMO samples (x =0.1, 0.2, 0.3, and 0.4), respectively, which were decreased with increasing the Pr-doping concentration. That is ascribed to that the double-exchange interactions in the LPCMO nanoparticles became weakened due to the narrower bandwidth and the reduced mobility of eg 電子。 Similarly, in the La1-x Ba x MnO 3 ( x =0.3, 0.5, and 0.6) nanocubes synthesized via hydrothermal methods, the low-temperature saturation magnetization was also decreased with increasing the Ba-doped content [46]. However, in the Ca1-x Smx MnO 3 (CSM, x =0.0–0.20) nanoparticles, the T C value was first abruptly decreased with increasing the Sm-doping concentration up to 0.05, but with a further increase in the doping level, it has monotonically augmented and approached a plateau above x =0.1, as shown in Fig. 20 [202]. The decrease in magnetic transition temperature demonstrates that the strength of the super-exchange interaction is reduced due to the dilution of the Mn 4+ lattice by Mn 3+ spins. While at moderate and larger doping regime, the magnetic behavior of nanograins are dominant by double exchange Mn 3+ –O–Mn 4+ interactions and the strong inter/intragrain coupling. The Msat was also increased linearly from 0 to 0.03, and then it was increased abruptly in the 0.03–0.05 doping level, approaching a plateau above x =0.1 (seen in Fig. 20). Besides, as a popular system, Ca-doped lanthanum manganite, especially the magnetic properties of Ca-doped lanthanum manganite nanoparticles with different Ca doping levels were investigated by several groups [203,204,205,206]. The reduction of the Msat due to the particle size reduction is attributed to the increase of magnetic dead layers. With decreasing the particle size, the finite-size effect causes the decrease of T C 。

Variation in saturation magnetization (M 土 ) and magnetic transition temperature (T C ) of the Ca1-x Smx MnO 3 nanopowders as a function of the Sm-doping concentrations. Solid and broken lines just show the trends. Reproduced with permission of [202]
To obtain information on the dynamical properties of magnetic nanoparticles, ac magnetic susceptibility is measured on cooling or heating the nanoparticle samples. The ac susceptibility (χac ) has two components:one is in-phase (χ') with the excitation while the other is a dissipative out of phase (χ") component. Figure 21 shows the ac susceptibility of the La0.8 Sr 0.2 MnO 3 nanoparticles (with particle size of 20 nm) versus temperature at an applied magnetic field of 1 mT and different frequencies (33.3, 111, 333.3, and 1000 Hz) [64]. In χ′(T) and χ″(T), a frequency-dependent peak near Tb =237 K (blocking/freezing temperature) was observed, which shifted to a higher temperature as increasing the frequency. The frequency dependence of the ac magnetic susceptibility and appearance of the irreversibility temperature in the field cooling (FC) and zero-field cooling (ZFC) magnetization patterns are the signature for super-paramagnetic/spin glass (SPM/SG) regime in both the interacting and non-interacting nanoparticles [207, 208]. Similar phenomenon was also reported for other perovskite manganite nanoparticles such as spin glass or super-spin glass behavior in La0.67 Sr 0.33 MnO 3 [209] and La0.6 Sr 0.4 MnO 3 nanoparticles [210], and SPM behavior in La2/3 Sr1/3 MnO 3 nanoparticles [211]. To reveal the dynamic behavior of magnetic nanoparticles and the nature of the Tb peak (SPM or SG) in of the La0.8 Sr 0.2 MnO 3 nanoparticles calcined at 600 °C for 3 h, three well-known phenomenological models (e.g., Neel-Brown model, Vogel-Fulcher model, and critical slowing down model) have been used to fit the experimental data of ac susceptibility of the sample. The best fitting results from the critical slowing down model indicate that there exists a strong interaction between the LSMO magnetic nanoparticles. However, in the La0.67 Sr 0.33 MnO 3 nanoparticles (with average particle size of 16 nm) prepared by sol-gel method, Rostamnejadi et al. [212] found that the experimental data of ac susceptibility was best fitted by the Vogel-Fulcher model, whereas the fitting the experimental data with Neel-Brown model and critical slowing down model give out unphysical value for the relaxation time. In addition, the unusually large value for the dynamic critical exponent and smaller value for relaxation time constant obtained from the fitting of data by critical slowing down model indicate that the spin-glass phase transition does not take place in this system of nanoparticles.

Ac susceptibility versus temperature for the La0.8 Sr 0.2 MnO 3 sample (particle size of 20 nm) at different frequencies. Inset is the imaginary part as a function of the temperature at different frequencies. Reproduced with permission of [64]
Magnetocaloric properties
Recently, the large magnetocaloric effect (MCE) in perovskite manganites has been widely studied [213, 214]. MCE originates from the heating or the cooling of magnetic material due to the application of magnetic field, which is characterized by the magnetic entropy change. The magnetic entropy change (ΔS) can be estimated from the M(H) curves and the use of the Maxwell’s relation
$$ \Delta {\mathrm{S}}_M={\int}_0^H{\left(\frac{\partial M\left(T,H\right)}{\partial T}\right)}_H\ dH $$ (1)ここで M is the magnetization, H is the magnetic field, and T は温度です。 The relative cooling power (RCP) proposed by Gschneidner et al. [215] is also an important parameter for selecting potential substances for magnetic refrigeration, which is described as the refrigeration capacity of magnetic refrigerant for magnetic refrigeration. It is evaluated using the relation
$$ \mathrm{RCP}=\left|{\left(\Delta {S}_M\right)}^{max}\right|\times \delta {T}_{FWHM} $$ (2)where δT is the full width at half maximum of a -ΔS(T) curve.
王ら。 [38] investigated the magnetocaloric effect in the Ln0.67 Sr 0.33 MnO 3 (Ln =La, Pr and Nd) nanoparticles prepared by using the sol-gel method. Figure 22a–c shows the temperature dependence of −∆S(T) under different changes of applied field from 1 to 5 T for LaSrMnO3 , PrSrMnO3 , and NdSrMnO3 nanoparticles, respectively. Under a field changing from 0 to 5 T, the maximum values of isothermal entropy change are found to be 2.49, 1.94, and 0.93 J/kg K for the samples with Ln =La, Pr, and Nd, respectively, and the corresponding values of RCP reach 225, 265, and 246 J/kg. The RCP as a function of magnetic field is presented in Fig. 22d. It is seen that the RCP increases in almost a linear way as the field increases. These results suggest that those nanoparticles could be useful for magnetic refrigeration in a broad temperature range.

Isothermal entropy changes as a function of temperature with field changes of 1, 2, 3, 4, and 5 T, a for LaSrMnO3 、 b for PrSrMnO3 、および c for NdSrMnO3 、 それぞれ。 d Relative cooling power (RCP) as a function of magnetic field for the Ln0.67 Sr 0.33 MnO 3 (Ln =La, Pr, and Nd) nanocrystalline samples. Reproduced with permission of [38]
Transport Properties
Transport property measurements of the manganite materials were carried out using standard four-terminal method on a Quantum Design PPMS system. At a constant applied field, resistance was measured as a function of temperature.クマール等。 [154] synthesized the (La0.6Pr0.4)0.65Ca0.35MnO3 nanoparticles via a sol-gel route at different sintering temperatures, and measured their electrical transport properties. The electrical resistivities (ρ ) as a function of temperature for the (La0.6 Pr0.4 )0.65 Ca0.35 MnO 3 nanoparticles sintered at 600 °C, 800 °C, and 1000 °C was shown in Fig. 23. It was observed that the (La0.6 Pr0.4 )0.65 Ca0.35 MnO 3 system shows insulator type behavior at higher temperatures due to the development of charge-ordered states in the nanocrystalline system, and starts to behave as a metal at lower temperatures because double exchange interaction plays a dominant role in the transport behavior of the system. The insulator-metal transition temperature (T IM ) and resistivity (ρ ) of nanoparticles are dependent upon the sintering temperature of the system (or the particle sizes). With increasing the sintering temperature, the particle (grain) size is increased; therefore, the effect of grain boundary is reduced and consequently the charge carriers in the nanocrystalline system face less scattering from the grain boundaries. This factor also improves the double exchange interaction mechanism and the system starts to show M–I transition at higher temperatures, and the resistivity of the system is also decreased significantly.

Variation of resistivity with the temperature for the (La0.6Pr0.4)0.65Ca0.35MnO3 nanoparticles sintered at 600 °C, 800 °C, and 1000 °C, respectively. Reproduced with permission of [154]
Zi etal。 [44] prepared La0.7 Sr 0.3 MnO 3 nanoparticles by a simple chemical co-precipitation route. To study the magnetoresistance (MR) effect, the magnetic field dependence of MR ratio at 10 K and 300 K by sweeping the applied magnetic field from − 20 to 20 kOe, was shown in Fig. 24. MR is defined as
$$ \mathrm{MR}=\frac{\rho_H-{\rho}_0}{\rho_0}\times 100\% $$ (3)
Magnetic field dependence of the MR curves from − 20 to 20 kOe at 10 K and 300 K for the La0.7 Sr 0.3 MnO 3 ナノ粒子。 Reproduced with permission of [44]
ここで、ρ H およびρ 0 refer to the resistivity under the applied and zero field, respectively. It can be seen that MR drops abruptly with the increasing field in low-field region, which is called as low-field magnetoresistance (LFMR). LFMR values at 10 and 300 K are 22.3% and 2.9% at 5 kOe, respectively. Because of the small coercive field, the alignment of the magnetization in each LSMO grain to the applied magnetic field occurs in the low-field region. At a comparatively high-field region above 5 kOe, MR decreases linearly with the applied field, but with a much reduced slope. High-field MR (HFMR) ratios at 10 and 300 K are 29.2% and 6.5% at 20 kOe, respectively. HFMR can be attributed to the non-collinear spins at LSMO boundaries.
To investigate the particle size effect on the transport properties of La0.7 Sr 0.3 MnO 3 (LSMO) nanoparticles, Navin and Kurchania [216] synthesized the LSMO nanoparticles with particle sizes of 20 nm (LSMO-1), 23 nm (LSMO-2), and 26 nm (LSMO-3), respectively. Figure 25 shows their temperature dependence of resistivity measured under (H =1 T) and without magnetic field in the temperature range of 10–300 K. It was found that the resistivity values of the LSMO-1 nanoparticles (Fig. 25a) were higher than that of the LSMO-2 (Fig. 25b) and LSMO-3 (Fig. 25c) nanoparticles. That is ascribed to the smaller particle size in the LSMO-1 sample. As the particle sizes become smaller, more grain boundaries in the samples acts as scattering centers to the charge carriers, resulting in the larger resistivity. Besides, it was found that the value of resistivity of all samples decrease under an external magnetic field of 1 T. The applied magnetic field gives rise to the increasing of spin ordering and the decreasing of the localization of the charge, which result in the reduction of resistivity. The LFMR property is related to the spin dependent scattering or spin dependent tunneling of the conduction electrons near the interfaces and grain boundaries. Figure 26a shows the temperature dependence of the MR of the samples LSMO-1, LSMO-2, and LSMO-3 at an applied magnetic field of 1 T. It was found that their MR values increase monotonically with decreasing the temperature. The LFMR at 1 T and 10 K for the samples LSMO-1, LSMO-2, and LSMO-3 was obtained as 32.3%, 28.4%, and 25.1% respectively. Obviously, the LFMR enhanced with decreasing the particle sizes. Figure 26b shows the magnetic field dependence of the normalized resistivity (ρH /ρo ) with applied magnetic field at temperatures 10 K and 300 K, where ρ0 and ρH are the resistivity without and with magnetic field respectively. A sharp drop in the value of resistivity in low magnetic field region was also observed and the resistivity does not saturate up to a magnetic field of 4 T.

Temperature dependence resistivity of the La0.7 Sr 0.3 MnO 3 (LSMO) nanoparticles with zero field and 1 T fitted by using ρ ( T ) = ρ 0 + ρ 2 T 2 + ρ 4.5 T 4.5 。 a LSMO-1 particles (average size of 20 nm), b LSMO-2 particles (average size of 23 nm), and c LSMO-3 particles (average size of 26 nm). Inset shows the fitting of the resistivity data in the low temperature region by using \( {\rho}_L={\rho}_0-{\rho}_s\ln T+{\rho}_e{T}^{\frac{1}{2}}+{\rho}_p{T}^5 \). Reproduced with permission of [216]

a Temperature dependence of the magnetoresistance (MR %) at 1 T. b Normalized resistivity as a function of the applied field at 10 K and 300 K of the La0.7 Sr 0.3 MnO 3 (LSMO) nanoparticles. LSMO-1, -2, and -3 particles with average particle sizes of 20 nm, 23 nm, and 26 nm, respectively. Reproduced with permission of [216]
The effects of doping levels on the electrical transport properties of perovskite manganite nanoparticles were also investigated. Thombare et al. [217] reported the electrical properties of Nd1-x Sr x MnO3-δ (NSMO, 0.3 ≤ × ≤ 7) nanoparticles synthesized by glycine assisted auto combustion method. Figure 27a shows the resistivity for NSMO in the temperature range 5–300 K at zero magnetic field. It is found that all plots show high resistivity. The resistivity values slightly increases with the Sr concentration up to 100 K, whereas below that the rise in resistivity is steeper. The M–I transition is not observed in the present NSMO nanoparticles without applied magnetic field. However, under applied magnetic field (H) of 8 T, the M–I transition temperature (TP ) was clearly observed around 12–48 K, as shown in Fig. 27b. These transition temperatures are lower than that in bulk counterpart. That may be due to the formation of small ferromagnetic clusters which are suffice for magnetic contribution but forbids conduction [218].

Temperature dependent resistivity for the Nd1-x Sr x MnO3-δ nanoparticles under different external magnetic fields. a H =0 and b H =8 T. Reproduced with permission of [217]
Optical Properties
The optical study of perovskite manganites has interestingly shown that they are controlled by the electronic structure of perovskites.クマール等。 [154] synthesized (La0.6 Pr0.4 )0.65 Ca0.35 MnO 3 nanoparticles by sol-gel method and post-annealed at 600 °C, 800 °C, and 1000 °C. To investigate the optical absorbance and evaluate the optical band gap of (La0.6 Pr0.4 )0.65 Ca0.35 MnO 3 , ultraviolet-visible (UV-Vis) spectroscopy measurements are carried out and the obtained UV-Vis spectra are shown in Fig. 28a. Obviously, there is a sharp absorption edge around 308 nm in ultraviolet region. The optical absorption edges can be analyzed as follows [219]:
$$ \alpha hv\propto {\left( hv-{E}_g\right)}^{\mathrm{n}} $$ (4)
a Ultraviolet-visible spectra of the (La0.6 Pr0.4 )0.65 Ca0.35 MnO 3 nanoparticles sintered at 600 °C, 800 °C, and 1000 °C. b Variation of (αhν ) 2 versus photon energy hν plot for the (La0.6 Pr0.4 )0.65 Ca0.35 MnO 3 nanoparticles sintered at 600 °C, 800 °C, and 1000 °C. Reproduced with permission of [154]
ここで E g is the band gap energy, hν is the photon energy, and α is the absorption coefficient, depending upon the optical absorbance (A) and thickness (d). n can be equal to 1/2 (for direct transition process) or 2 (for indirect transition process). The variations of (αhν ) 2 versus photon energy (hν ) for the (La0.6 Pr0.4 )0.65 Ca0.35 MnO 3 nanoparticles post-annealed at 600 °C, 800 °C, and 1000 °C are plotted in Fig. 28b. It is observed that (αhν) 2 varies linearly for a very wide range of photon energy (hν ), indicating a direct type of transitions in these systems. The intercepts of these plots on the energy axis give the energy band gaps of the systems, which were determined to be 3.52, 3.46, and 3.42 eV, respectively, for the (La0.6 Pr0.4 )0.65 Ca0.35 MnO 3 nanoparticles post-annealed at 600 °C, 800 °C, and 1000 °C. These direct band gaps fall into the range of wide band gap semiconductors. The decrease of the band gap (red-shift) with increasing post-annealing temperature can be attributed to the increased particle sizes. Negi et al. [220] also investigated the optical properties of GdMnO3 nanoparticles synthesized by the modified sol-gel route. The room temperature optical absorption spectrum of the GdMnO3 nanoparticles measured in the range of 200–600 nm clearly shows that the absorbance is less in the range of 380–600 nm. The low absorbance in the entire visible region is an essential condition for nonlinear optical applications [221]. An extrapolation of the linear region of a plot of (αhν) 2 on the y -axis versus photon energy (hν ) on the x -axis gives the optical band gap ∼ 2.9 eV.
1D Rare Earth-Doped Perovskite Manganite Oxide Nanostructures
Magnetic Properties
チャンドラら[222] synthesized La0.67 Ca 0.33 MnO 3 crystalline nanowires with the average diameter of 70 nm by using porous templates of anodized alumina combined with CSD technique. Their temperature dependence of magnetization (M) measured at ZFC and FC modes and under a magnetic field of 100 Oe demonstrates that these nanowires undergo a PM to FM transition at T C =245 K, which is defined by the minimum in dM /dT 。 Similar feature was also reported for the La0.67 Ca 0.33 MnO 3 nanotubes [87]. Datta etal。 [157] also synthesized La1-x Ax MnO 3 (where A =Ca, Sr; x =0.3 and 0.5) nanowires by hydrothermal method. All the nanowires undergo FM–PM phase transitions with increasing the temperature. Their T C values are dependent upon the crystal structure as well as the Mn valence and oxygen stoichiometry.
Wang and Fan [223] reported on the magnetic properties of electron-doped Ca0.82 La0.18 MnO 3 nanowires and nanoparticles, and compared them with their bulk counterpart. It is found that the Ca0.82 La0.18 MnO 3 bulk exhibits a strong charge ordering (CO) peak at T CO =132 K followed by an AFM ground state, whereas the CO peak becomes weak in the nanowires (T CO =124 K), and disappeared in the nanoparticles which exhibits a ferromagnetism with T C =165 K. Chandra et al. [224] also reported on the magnetic properties of the single-crystalline La0.5 Sr 0.5 MnO 3 nanowires with diameter of 20–50 nm and length of 1–10 μm synthesized by the hydrothermal technique. Figure 29a–d shows their temperature dependence of dc magnetization M (T) measured under different applied magnetic fields. As the temperature is lowered from 340 K, the nanowires exhibit a PM to FM transition at T C ∼315 K followed by a peak at T N ∼210 K, which is associated with the onset of the FM–AFM transition. As the applied magnetic field is increased, the irreversible temperature shifts to lower temperatures as shown in Fig. 29b–d. Figure 29e, f demonstrates the temperature dependences of the real (χ ′) and imaginary (χ ′′) parts of ac susceptibility in the temperature range of 10–340 K, respectively. The χ ′ (T ) curves show a maximum at T N with no frequency dependence and a kink at T L 。 In addition, the χ ′′ (T ) curves, which reveal insight into magnetic loss behavior, showing a peak at T C , a broad shoulder at T N , and a kink at T L 。 The χ ′ (T ) peak shifts to a higher temperature as the frequency is increased, which is consistent with the results reported previously [225, 226].

a 、 b Zero-field-cooled (ZFC) (blue), field-cooled-cooling (FCC) (green), and field-cooled-warming (FCW) (red) magnetization curves of the La0.5 Sr 0.5 MnO 3 nanowires measured under applied fields of a 100 Oe and b 1000 Oe. c 、 d ZFC and FCW magnetization curves obtained under applied magnetic field of c 2000 Oe and d 5000 Oe. e Real and f imaginary parts of linear ac susceptibility versus temperature plots for different frequencies. The inset of (e ) shows a magnified view of χ’(T ) for more frequencies. Reproduced with permission of [224]
Magnetocaloric properties
Kumaresavanji et al. [227] reported on the MCE in La0.7 Ca 0.3 MnO 3 nanotube arrays, which were synthesized by template-assisted sol-gel method in temperatures ranging from 179 to 293 K and under magnetic fields up to 5 T. Their temperature dependence of −∆S M at different fields for nanotube arrays and bulk is plotted in Fig. 30a, b. When compared with the bulk counterpart (4.8 J/kg K), the magnitude of the ∆S M (1.9 J/kg K) is smaller for nanotube arrays. In addition, the temperature dependence of −∆S M curves for bulk sample show a narrow peak at 258 K which become broader and shift to lower temperature for nanotube arrays. The refrigerant capacitance (RC), is also an important parameter for selecting potential substances for magnetic refrigeration, which is described as the amount of heat transferred between the hot and cold sinks in one ideal refrigeration cycle. It is evaluated using the relation
$$ RC(H)={\int}_{T_1}^{T_2}\Delta {S}_M\left(T,H\right) dT $$ (5)
Temperature dependence of −∆S M curves for a La0.7 Ca 0.3 MnO 3 (LCMO) nanotube (NT) arrays and b LCMO bulk at different fields. c RC and δ TFWHM with respect to the field of the LCMO NT arrays and LCMO bulk sample. d Temperature dependence of −∆S M curves of the LCMO NT arrays and bulk at 5 T. Reproduced with permission of [227]
ここで T 1 および T 2 are the temperatures of cold and hot reservoirs, respectively, which correspond to the full width at half maximum (δTFWHM ) of the ∆S M 曲線。 The calculated δTFWHM and RC values for nanotube arrays and bulk samples are depicted in Fig. 30c. The RC values vary linearly with H in both cases. Moreover, the RC value is reasonably large for bulk sample compared to nanotube arrays. However, the δTFWHM values of nanotube arrays are nearly 54% larger than the observed one for bulk sample. The temperature dependence of ∆S M curves of nanotube arrays and bulk at a field of 5 T are comparatively shown in Fig. 30d. The shadow part represents the δTFWHM of nanotube arrays which is nearly three times larger than their bulk counterpart. From this figure, one can understand how the nanotube arrays provide an expanded working temperature range compared to the bulk one. Even though the nanotube arrays present a broader ∆S M curve, the ∆S M value is lower compared to the bulk sample. However, the higher surface to volume ratio together with the hollow structure and broader peaks of ∆S M indicate that the manganite nanotubes could be a suitable material for magnetic refrigeration in nano-electromechanical systems. The magnetocaloric properties of La0.6 Ca0.4 MnO 3 nanotubes with diameter of 280 nm and wall thickness of 10 nm were also reported by Andrade et al. [228]. It is found that the decrease of ∆S is commonly accompanied by a broadening in the ∆S curve. The RCP of nanoparticles is decreased with decreasing the particle size, but they still possess a larger cooling power than the nanotubes of the same compound, due to the broadening of the magnetic transition observed in these samples. In this way, it is important to notice that the reduced maximum value of ∆S observed for nanosystems is often accompanied by a broad magnetic entropy change.
Transport Properties
Lei et al. [229] successfully synthesized single-crystalline MgO/La0.67 Ca 0.33 MnO 3 core-shell nanowires (MgO core is ∼ 20 nm in diameter and the La0.67 Ca 0.33 MnO 3 shell layer is ∼ 10 nm in thickness) by depositing epitaxial La0.67 Ca 0.33 MnO 3 sheaths onto MgO nanowire templates through the PLD technique. Transport investigations were carried out by measuring the four-probe resistance of individual core-shell nanowires, as shown in Fig. 31. The SEM image of a typical device with a 5-μm-long nanowire and four uniformly distributed electrodes is shown in Fig. 31a. The four-probe resistance of an MgO/La0.67 Ca 0.33 MnO 3 nanowire was recorded as a function of temperature under two different magnetic fields (0 and 1 T), as shown in Fig. 31b. This M–I transition occurred at ∼ 140 K under zero magnetic field, and the transition temperature shifted to ∼ 160 K when a magnetic field of 1 T was applied normal to the device substrate. This M–I transition and transition temperature shifting effect induced by magnetic fields strongly suggest a correlation between the ferromagnetism and the metallicity, which is ascribed to the double-exchange mechanism. This M–I transition associated with FM to PM transition also happened in the MgO/La0.67 Sr 0.33 MnO 3 core-shell nanowires with T MI ∼240 K at H =0 and the T MI shifted to ∼ 250 K under a perpendicular magnetic field of 1 T (Fig. 31c). In addition, MR measurements were also performed with both MgO/La0.67 Ca 0.33 MnO 3 (inset of Fig. 31b) and MgO/La0.67 Sr 0.33 MnO 3 (inset of Fig. 31c) core-shell nanowires at their transition temperature by sweeping the perpendicular magnetic field between ± 2.0 T. By defining the MR ratio as [R(H) - R(0)]/R(0) × 100%, a value of MR =34% was achieved at T =140 K and H =2.0 T for La0.67 Ca0.3d3 MnO 3 (inset of Fig. 31b), and 12% was achieved at T =240 K and H =2.0 T for La0.67 Sr 0.33 MnO 3 (inset of Fig. 31c).

a Top view SEM image of a core-shell nanowire device showing four Ag/Au contact electrodes with even spacing. b 、 c Four-probe resistance (R ) vs. temperature (T ) curves measured under two different magnetic fields B =0 T (red) and B =1 T (blue), with b MgO/LaCaMnO3 (LCMO) nanowire and c MgO/LaSrMnO3 (LSMO) nanowire. Insets of panels b 、 c magnetoresistance (MR) recorded at temperature T =140 K for panel b および T =240 K for panel c 、 それぞれ。 Reproduced with permission of [229]
Optical Properties
Arabi et al. [80] synthesized the La0.7 Ca 0.3 MnO 3 nanorods by hydrothermal method under different conditions (e.g., different mineralization agents KOH and NaOH; various alkalinity conditions (10, 15, and 20 M)). The UV–Vis absorption spectra of all the La0.7 Ca 0.3 MnO 3 nanorods are shown in Fig. 32a, where three obvious peaks are observed due to optical response in these La0.7 Ca 0.3 MnO 3 nanorods. The first peak was observed around 220 nm (5.6 eV) for all the samples. Strong absorption peak appeared at wavelengths about 325–380 nm (3.8–3.3 eV) and the third peak appeared around 950 nm (1.3 eV) in all the samples, as shown in inset of Fig. 32a. It is found that a decrease and broadening of the absorption peaks for the N-series samples is related to size reduction. Figure 32b shows the curves of (αhv ) 2 versus hv , and the intercepts of these plots on the hν axis provide the optical band gaps. It can be obtained that the main band gaps are estimated to be 2.48, 2.39, and 2.19 eV for the samples K10, K15, and K20 as well as 2.18, 2.25, and 2.32 eV for the samples N10, N15, and N20, respectively. Recently, Arabi et al. [230] also investigated the optical properties of La0. 68 Ca0. 32 MnO 3 nanowires prepared by hydrothermal method. Their optical band gap is estimated to be about 2.13 eV.

a UV–Vis absorption response of the La0.7 Ca 0.3 MnO 3 (LCMO) nanorods synthesized by hydrothermal method under different alkalinity conditions. b The variation of (αhv ) 2 absorption versus hv (photon energy) for the different samples (N10, N15, N20, K10, K15, and K20). N (or K) means the NaOH (or KOH) mineralizer, 10 (or 15, 20) for the NaOH (or KOH) concentration. Reproduced with permission of [80]
2D Rare Earth-Doped Perovskite Manganite Oxide Nanostructures
Magnetic Properties
Shao et al. [106] fabricated La0.325 Pr0.3 Ca0.375 MnO 3 single-crystalline disks with diameters from 500 nm to 20 μm to study the spatial confinement effect on EPS. By using electron beam lithography with a negative tone resist, the La0.325 Pr0.3 Ca0.375 MnO 3 disks were derived from the epitaxial La0.325 Pr0.3 Ca0.375 MnO 3 films with thickness of 60 nm grown on STO(001) substrates by PLD. Magnetic properties of these La0.325 Pr0.3 Ca0.375 MnO 3 disk arrays are measured by SQUID and MFM. Figure 33 shows the transition from the EPS state to a single ferromagnetic metallic (FMM) state. Figure 33a shows the AFM images of the morphologies for the La0.325 Pr0.3 Ca0.375 MnO 3 disks with different diameters. The corresponding MFM images of the La0.325 Pr0.3 Ca0.375 MnO 3 disks acquired at different temperatures (10 K, 100 K, and 180 K) under a perpendicular magnetic field of 1 T are shown in Fig. 33b–d. In the color scale, the contrast below zero (red or black) represents FMM phase, while the contrast above zero (green or blue) represents non-ferromagnetic phase. Obviously, all the disks show distinct features of the EPS state (i.e., the coexistence of the FMM and charge order insulating (COI) phases), except for the 500 nm disk. The typical length scale of the EPS domains is around a micrometer. It was also found that with decreasing temperature, the portion of FMM phase was increased.

a AFM images of the La0.325 Pr0.3 Ca0.375 MnO 3 (LPCMO) disks with diameter sizes of 500 nm, 1 μm, 2 μm, 3.8 μm, 5 μm, and 7 μm in diameter. b – d MFM images of the LPCMO disks under external magnetic field of 1 T (external magnetic field direction is pointing perpendicularly to the sample surface plane) taken at 10 K (b ), 100 K (c ), and 180 K (d )。 The negative value in MFM image indicates attractive force and positive value indicates repulsive force. Reproduced with permission of [106]
Huijben et al. [231] grew ultrathin La0.7 Sr 0.3 MnO 3 films with thicknesses from 3 to 70 unit cells on STO substrates by PLD method. Their magnetic properties are shown in Fig. 34. Figure 34a shows the M -H loops of all samples. It is observed that the saturation magnetization (M S ) is increased with increasing the film thickness up to 13 unit cells (~ 48 Å), whereas the coercive field (H C ) is decreased. M - T curves for all the films with different thickness are displayed in Fig. 34b, from which the Curie temperature T C is determined. The thicknesses dependent of H C および T C is shown in Fig. 34c. It is found that H C および T C are nearly constant for thicknesses down to 13 unit cells. Further reduction in the film thickness results in a dramatic change in the magnetic properties, although the films remain ferromagnetic down to three unit cells (~ 12 Å).

Ferromagnetic properties of ultrathin La0.7 Sr 0.3 MnO 3 films on SrTiO3 (001). a Magnetic hysteresis loops measured at 10 K. The diamagnetic contribution to magnetization not shown has been attributed to the substrate and has been subtracted. b Temperature dependence of the magnetization measured at 100 Oe. All samples were field cooled at 1 T from 360 K along the [100] direction before the measurements were performed. c Layer thickness dependence on the coercive field H C and the Curie temperature T C 。 Reproduced with permission of [231]
Magnetocaloric Properties
Debnath et al. [232] reported on the magnetocaloric properties of an epitaxial La0.8 Ca0.2 MnO 3 /LaAlO3 thin film grown by PLD method. The magnetic entropy changes in the La0.8 Ca0.2 MnO 3 thin film for different magnetic field directions are shown in Fig. 35a–c, respectively. |∆S M | exhibits a peak with its maximum around 247 K near T C 。 The maximum values of |∆S M | were estimated to be 35.90, 27.50, and 24.97 mJ cm −3 K -1 under a field change of 1 T for the different field directions, H//ab, H//45°, and H//c, respectively. The |∆S M | peaks in all directions are significantly broadened over a wider temperature region. The RCP values of the thin film under different field directions are shown in Fig. 35d. Large RCP values (i.e., 1000 mJ/cm 3 for the ab plane and 780 mJ/cm 3 for the c-direction) are obtained, which are higher than those observed in other perovskite manganites and rare earth alloys [213, 233, 234]. Such higher entropy change value and higher RCP with no noticeable hysteresis loss will make the epitaxial La0.8 Ca0.2 MnO 3 films more attractive for use as a magnetic refrigeration with large useful temperature ranges.

a–c Magnetic entropy changes in the La0.8 Ca0.2 MnO 3 thin films as a function of temperature and external magnetic field in different directions. a H//ab 、 b H//45°, and c H//c 。 d Relative cooling power (RCP) of the thin film as a function of magnetic field in different field directions. Reproduced with permission of [232]
Giri et al. [235] deposited epitaxial Sm0.55 Sr0.45 MnO 3 thin films on LAO(001), LSAT(001), and STO(001) single crystal substrates by PLD technique, and the relationship between magnetocaloric effect and lattice strain induced by the substrates was investigated. The temperature-dependent |∆S M | values at different magnetic field calculated from M -H data for the Sm0.55 Sr0.45 MnO 3 thin films grown on LAO (001), LSAT (001), and STO (001) single crystal substrates are shown in Fig. 36a–c, respectively. It is interesting to notice that the values of |∆S M | can be modulated by the lattice strain induced by the different substrates. The maximum value of |∆S M | was found to be ~ 10 J kg −1 K -1 for the Sm0.55 Sr0.45 MnO 3 films grown on STO under a field change of 6 T. The inset of Fig. 36a shows the M-H loop measured at 10 K with increasing and decreasing magnetic fields of the films grown on STO. The field hysteretic loss is very less, which is a well characteristic of magnetic refrigeration. This low-field large magnetic entropy change in the thin film is mainly due to the rapid change of magnetization near the transition temperature in the easy magnetization plane. The specific heat (C P ) data of the Sm0.55 Sr0.45 MnO 3 film grown on LAO substrate is shown in Fig. 36d, which clearly shows a lambda-shaped anomaly close to T C 。 This is mainly arisen due to second-order magnetic phase transition. The peak temperature of C P of the film matches well with T C determined by dc magnetization measurement. The values of relative cooling power (RCP) are usually calculated for both the cases (near T C and around T p), and several methods have been used to calculate the value of RCP. For example, in the first method, RCP-1 is calculated from the product of maximum peak value |∆S M | and the full width at half maximum, δT FWHM , i.e., RCP-1 =\( \left|{\Delta S}_M^{Max}\right| \)×δT FWHM 。 In second method, RCP-2 is estimated from the maximum value (area) of the product |∆S M | ×ΔT under the |∆S M | vs. T curve. The ΔS M versus T curve of the Sm0.55 Sr0.45 MnO 3 films grown on STO at magnetic field of 6 T is shown in Fig. 36e. The bigger rectangular sketch and shaded area corresponds to RCP-1 and RCP-2, respectively. Inset in Fig. 36e shows the value of RCP-2 as a function of magnetic field for three different films. Figure 36f demonstrates the value of RCP-1 as a function of magnetic field for three different films. It can be observed that for both the temperature regime, the value of RCP increases with increasing the magnetic fields. An important observation is that the values of RCP are significantly larger around T C than T p 。 Therefore, a material in the same refrigeration cycle with higher RCP is preferred as it would confirm the transport of a greater amount of heat in an ideal refrigeration cycle. The epitaxial Sm0.55 Sr0.45 MnO 3 films grown on STO exhibit large MCE modulated by lattice strain; their larger |∆S M | and enhanced RCP with almost zero hysteresis loss make them ideal for magnetic refrigeration, providing an alternative approach in searching for energy efficient magnetic refrigerators.

a–c Temperature dependent|∆S M | at different magnetic field calculated from M–H data for the SSMO/STO, SSMO/LSAT, and SSMO/LAO films, respectively. Inset of (b ) and its inset shows the one cycle M–H curves of the SSMO/LSAT film in the temperature interval of 2 K and 1 K, respectively. Inset of (c ) shows one cycle M–H curves of the SSMO/LAO films in the temperature interval of 5 K. d CP (T) of the SSMO/LAO film at μ 0 H =0 T. e The ∆S M vs. T curve of the SSMO/STO film at μ 0 H =6 T. The bigger rectangular sketch and shaded area corresponds to RCP-1 and RCP-2, respectively. Inset shows the value of RCP-2 as a function of magnetic field for three different films. f The value of RCP-1 as a function of magnetic field for three different films. Sm0.55 Sr0.45 MnO 3 (SSMO) thin films deposited on LaAlO3 (LAO), SrTiO3 (STO), and (La0.18 Sr0.82 )(Al0.59 Ta0.41 )O3 (LSAT) single crystalline substrates are named as SSMO/STO, SSMO/LSAT, and SSMO/LAO, respectively. Reproduced with permission of [235]
Transport Properties
Chen etal。 [236] investigated the transport properties of (La1-x Prx )0.67 Ca 0.33 MnO 3 (0 ≤ × ≤ 0.35) films (with thicknesses from 9 to 60 nm) grown on NGO(110)OR substrates by PLD. Their temperature coefficient of resistance (TCR, defined by (dρ/dT)/ρ, where ρ is the resistivity and T the temperature) is shown in Fig. 37a. The inset shows the corresponding ρ-T curves. The doping-level dependent TC and TCR peak values are shown in Fig. 37b. Obviously, the monotonous reduction of T C is accompanied by the increasing Pr-doping. TCR value greatly relies on the Pr-doping level x , which reaches the maximum value at 88.17% K −1 when doped at x =0.25. The (La1-x Prx )0.67 Ca 0.33 MnO 3 film at x =0.25 may give a suitable FMM clusters size and distribution, leading to a sharp MIT with an optimized TCR. Dhakal et al. [105] also reported on the electrical properties of the (La1-y Pry )0.67 Ca 0.33 MnO 3 ( y =0.4, 0.5, and 0.6) films with thickness of 30 nm grown on NGO(110) and STO(100) substrates by PLD. They found that the M-I transition temperature T MI was decreased with increasing the Pr-doping concentration due to the reduction of average A-site cation radii <r A > 。 The transport properties of La0.8-x Pr0.2 Sr x MnO 3 ( x =0.1, 0.2, and 0.3) manganite films were also reported by Solanki et al. [118]. Their results confirmed the effects of Sr-concentration on transport properties. As smaller sized Pr 3+ substituted at La-site in LaMnO3 results in the reduction in Mn-O-Mn bond angle from 180° making superexchange competitive with Zener double exchange, while substitution of Sr 2+ in La0.8-x Pr0.2 Sr x MnO 3 system results in the increase in lattice parameters and the Mn-O-Mn bond angle toward 180°. Increase in Sr-concentration (from x =0.1 to 0.3) enhances the eg electron bandwidth due to larger size of Sr 2+ ion, promoting the motion of more itinerant electrons between Mn 3+ およびMn 4+ which in turn suppresses resistivity and enhances TP (metal–insulator/semiconductor transition temperature). In addition, due to substitution of Sr 2+ (x) at La-site, average grain size increases and grain boundary density decreases resulting in the suppression in scattering of eg electrons which in turn increases T P 。

a Temperature dependence of TCR for the 30 nm (La1-x Prx )0.67 Ca 0.33 MnO 3 (LPCMO)/ NdGaO3 (NGO) films at various doping levels (x =0–0.35) at zero field. The inset shows the corresponding ρ - T 曲線。 b T C and TCR (peak value) as a function of the Pr doping level x, extracted from the ρ - T curves measured during cooling. Reproduced with permission of [236]
The thickness-dependent transport properties of the La0.7 Pb0.3 MnO 3 manganite films grown on LAO(100) single crystal substrates by CSD technique are also reported [115]. Figure 38a shows the ρ - T data of all the La0.7 Pb0.3 MnO 3 /LAO films under zero applied field. It is found that the ρ decreases and T P increases up to 269 K (with thickness of 350 nm) as increasing the film thickness, which is ascribed to the total (in plane and out of plane) strain relaxation effect. Figure 38b shows low temperature MR behavior of various thickness films and bulk, the MR isotherms, at 5 K. It was found that bulk exhibits MR ~ 38% at 9 T, while the film only shows MR ~ 42% at room temperature. In addition, as the film thickness is increased, MR value at 5 K increases from 5% for 150 nm film to 18% for 350 nm film. This observation suggests the thickness-dependent microstructural effect on the transport and MR behavior of the La0.7 Pb0.3 MnO 3 /LAO films at low temperature under high fields. The thickness-dependent transport properties in the La0.7 Sr 0.3 MnO 3 thin films are also reported [116, 117, 237,238,239].

a ρ-T plots for the La0.7 Pb0.3 MnO 3 (LPMO)/LaAlO3 (LAO) thin films grown by chemical solution deposition (CSD) method with various thicknesses. Inset (a ):resistivity vs. temperature plot for bulk LPMO sample. Inset (b ):enlarged view of low temperature (below 80 K) dependent resistivity behavior for the LPMO/LAO thin films having various thicknesses. b MR vs. H isotherms recorded at 5 K for the CSD grown LPMO/LAO thin films with different thicknesses and bulk LPMO sample. Reproduced with permission of [115]
Optical Properties
Cesaria et al. [240] reported the optical response of 200-nm-thick La0.7 Sr 0.3 MnO3-δ films, which were deposited by PLD on amorphous silica substrates at nearly 600 °C under different oxygen pressures (0.1, 0.5, 1, 5, and 10 Pa). A blue-shift of the transmittance-curve edge was observed as the p(O2 ) was increases from 1 to 10 Pa. That is ascribed to the changes of oxygen non-stoichiometry in the films, leading to larger Mn 4+ /Mn 3+ ratios under higher oxygen pressure. In order to in-depth understand the optical response of the deposited films, the nature (direct or indirect) of the optical transitions in the films were investigated by plotting (Eα ( E )) n versus the photon energy (E ) for n =1/2 and 2, where α ( E ) is the absorption coefficient. n is equal to 1/2 for indirect transition process or 2 for direct transition process. The graphs of (Eα ( E )) 2 versus energy E for all the deposited films exhibit a linear regions, as shown in Fig. 39a, from which the direct energy gap values (E g ) for the thin films can be estimated by extrapolation to the energy axis of the linear regions of the graphs. In the allowed direct transitions, the lowest energy one at nearly 1.0 eV was observed only for the films grown under oxygen pressures of 0.1 Pa and 0.5 Pa. That can be assigned to electronic excitations Mn 3+ (\( {\mathrm{e}}_g^1 \))→Mn 3+ (\( {\mathrm{e}}_g^2 \)) from a bound state (owed to the lattice distortion around the Mn 3+ ion) into a final state also bound by lattice distortions. The highest observed transition appeared at nearly 3.5 eV. Other transitions were yielded at intermediate energies for all the examined values of p(O2 ):optical transitions of at least 2.45 eV were observed with increasing energy as p(O2 ) was increased. The films grown under oxygen pressures of 10 Pa exhibited further transitions (at 3.04 eV and 3.50 eV), which can be assigned to transitions from O 2p states to the higher energy Mn 3+ (\( {\mathrm{e}}_g^2 \)) band. In the plots of (Eα ( E )) 1/2 versus energy (E ) of the films grown under the oxygen pressure of 10 Pa and 0.5 Pa, linear regions were also observed, as shown in Fig. 39b, which may be assigned to indirect transitions (phonon assisted transitions, i.e., phonon absorption and phonon emission) or indicative of amorphous nature. The occurrence of two adjacent linear dependences cab be interpreted as corresponding to phonon absorption and phonon emission processes leading to an indirect band gap. Indirect transitions are assigned to the films grown under oxygen pressures of 10 Pa, 5 Pa, and 1 Pa, and amorphous nature is detected in the films grown under oxygen pressures of 0.5 Pa and 0.1 Pa. Tanguturi et al. [241] reported the optical properties of Nd0.7 Sr 0.3 MnO 3 films grown on amorphous-SiO2 基板。 In the absorption coefficient spectra of the as-deposited and annealed films, a broad peak in the region hv < 2 eV was observed and beyond that they rose rapidly up to around 4 eV. Beyond 4 eV, no appreciable change in the spectrum was observed. The energy band gaps of the films were determined by plotting (αE ) 2 as a function of energy (E ), which were determined to be 2.98 eV and 2.64 eV for the as-deposited and annealed films, respectively. Therefore, the amorphous film exhibits larger band gap as compared with the crystalline one. Such a large band gap value in amorphous phase is a known phenomenon [242].

a Plots of (Eα ( E )) 2 versus photon energy (E ) of the LSMO films grown under different oxygen pressures. The direct transitions are identified by extrapolation of the straight line portions to energy axis. b Plots of (Eα ( E )) 1/2 versus photon energy (E ) of the LSMO films grown under oxygen pressures of 10 Pa and 0.5 Pa. Linear regions occur that are indicative of indirect transitions in the LSMO films grown under oxygen pressure of 10 and the amorphous nature for LSMO films grown under oxygen pressure of 0.5 Pa. Reproduced with permission of [240]
3D Rare Earth-Doped Perovskite Manganite Oxide Nanostructures
Up to date, only a limited works on 3D rare earth-doped perovskite manganite oxide nanostructures are available. Here, an example of 3D rare earth-doped perovskite manganite oxide nanostructure is demonstrated, which is constructed by interlayering La0.7 Sr 0.3 MnO 3 (LSMO)–CeO2 -based epitaxial vertically aligned nanocomposite (VAN) thin films with pure CeO2 (or LSMO) layers. This 3D strained framework nanostructures combine both the lateral strain by the layered structures and the vertical strain in the VAN, and thus maximize the 3D strain states in the systems, manipulating the electron transport paths in these systems. For example, in the 3D nanostructured LSMO–CeO2 VAN systems, the electrical transport properties can be effectively tuned from a 3D insulating CeO2 framework with integrated magnetic tunnel junction structures, to a 3D conducting LSMO framework by varying the types of the interlayers (i.e., CeO2 or LSMO) and the number of interlayers from 1 to 3 layers [198]. Figure 40 shows the transport properties of these 3D framed nanostructures. The temperature-dependent resistance (R–T) curves at zero-field are shown in Fig. 40a for samples C0–C3, and Fig. 40b depicts the temperature dependence of the MR (%) in the 3D-framed nanostructures C0–C3. It is observed that in Fig. 40a, the resistance is decreased with increasing temperature, indicating typical semiconductor behavior in C0–C3 due to the large portion of CeO2 introduced in the nanostructures (CeO2 :LSMO ≥ 1:1 in C0–C3). The MR (%) of the films C0–C3 is increased at first and then reduced as the temperature increasing from low temperature to room temperature. Therefore, a MR peak is observed around 50 K. It is also noticed that the 3D CeO2 frameworks could enhance the overall MR properties; for example, the MR peak value is increased from 40% (C0) to 51% (C3), 57% (C2), and maximized at 66% (C1). Such an enhancement can be ascribed to the 3D CeO2 framework not only tailoring the out-of-plane strain of the LSMO phase but also building up the 3D tunneling framework for the electron transport. The relatively lower MR (%) in C2 and C3 samples compared to C1 is possibly related to the surface roughness observed in both samples where the 3D insulating framework might not be effective in the top layers. In contrast to the C1–C3 samples, a metallic behavior is observed in the L1–L3 samples with a 3D LSMO framework, as shown in Fig. 40c. The resistances are gradually increased from 10 to 350 K with a M–I transition temperature (T MI ) at ~ 325 K. Such a metallic behavior is associated with the high composition of LSMO in L1–L3 and the 3D interconnected conductive LSMO frames built in the composite films L1–L3. Meanwhile, the resistance of the composite films L1–L3 decreases with inserting more lateral LSMO interlayers over the entire temperature regime. The LSMO interlayers interconnect with the vertical LSMO domains forming a conductive 3D frame in the film. Thus, the tunneling MR effect is effectively reduced. Figure 40d demonstrates the temperature dependence of MR for the nanocomposite thin films L0–L3 with the M–I transition temperature (T MI ) marked for samples L1–L3. It is observed that such L1–L3 structures enable higher MR values at higher temperatures, e.g., 13% at 316 K in sample L2, which is a dramatic MR value improvement compared to C0–C3 and the previous reports at higher temperatures (e.g., near room temperature). Based on the above observations, it is clear that magnetic tunneling junctions (MTJ) of the LSMO/CeO2 /LSMO and their geometrical arrangement in the 3D framework nanostructures are very important for enhancing the low-field MR properties. In C1–C3 samples, there are effective vertical and lateral MTJ structures integrated in the system by incorporating CeO2 interlayers in the VAN system, such 3D insulating frameworks effectively maximize the 3D magnetic tunneling effect and lead to a record high MR% in the LSMO based systems. This 3D strain framework concept opens up a new avenue to maximize the film strain beyond the initial critical thickness and can be applied to many other material systems with strain-enabled functionalities beyond magneto-transport properties.

a R–T plots of 3D CeO2 framed nanocomposite thin films C0—C3. b The temperature dependence of MR for the nanocomposite thin films C0–C3. c R–T plots of 3D La0.7 Sr 0.3 MnO 3 (LSMO) framed nanocomposite thin films L0–L3. The arrows point out the metal-to-insulator transition temperature TMI of L1–L3. d The temperature dependence of MR for the nanocomposite thin films L0 - L3 with the metal-to-insulator transition temperature TMI marked for samples L1–L3. The single layer LSMO - CeO2 VAN thin films are named as C0 or L0, without LSMO or CeO2 as the interlayers. 3D CeO2 interlayered thin films with 1, 2, and 3 interlayers inserted in VAN structures are named as samples C1, C2, and C3, respectively. Similarly, 3D LSMO interlayered thin films with 1, 2, and 3 interlayers inserted in VAN are named as sample L1, L2, and L3, respectively. Reproduced with permission of [198]
Applications of Rare Earth-Doped Perovskite Manganite Oxide Nanostructures
Rare Earth-Doped Perovskite Manganite Oxide Nanoparticles
Magnetic Refrigeration
Magnetocaloric effect (MCE) makes magnetic materials attractive for potential applications in magnetic refrigeration. As compared to the conventional gas compression technology, the magnetic refrigeration technology offers many advantages, such as no use of any gasses or hazardous chemicals, low energy consumption, and low capital cost [243,244,245].
Mahato et al. [246] synthesized La0.7 Te0.3 MnO 3 nanoparticles with average particle size of 52 nm where a large magnetic entropy change of 12.5 J kg −1 K -1 was obtained near T C for a field change of 50 kOe. These results confirmed the application for magnetic refrigeration.ヤンら。 [247] reported that for La0.7 Ca 0.3 MnO 3 nanoparticles with average size of 30 and 50 nm, their maximum magnetic entropy changes at 15 kOe applied field were 1.01 and 1.20 J kg −1 K -1 , respectively, indicating that the La0.7 Ca 0.3 MnO 3 nanoparticles could be considered as a potential candidate for magnetic refrigeration applications at room temperature. Phan et al. [248] demonstrated strong enhancement of both the MCE and refrigerant capacity in the nanostructured mixed phase manganite of La0.35 Pr0.275 Ca0.375 MnO 3 (with an average particle size of 50 nm). Compared to other candidates such as Pr0.65 (Ca0.7 Sr 0.3 )0.35 MnO 3 (~ 67 nm) [249], the higher entropy change (\( -{\Delta \mathrm{S}}_{\mathrm{M}}^{\mathrm{M}\mathrm{ax}} \)) and RC (refrigerant capacity) values were achieved in the nanocrystalline sample.
Biomedical Applications
Magnetic nanoparticles offer some attractive possibilities in biomedicine. First, they have controllable sizes ranging from a few nanometers up to tens of nanometers, which places them at dimensions that are smaller than or comparable to those of a cell (10–100 μm), a virus (20–450 nm), a protein (5–50 nm), or a gene (2 nm wide and 10–100 nm long). This means that they can “get close” to a biological entity of interest. Indeed, they can be coated with biological molecules to make them interact with or bind to a biological entity, thereby providing a controllable means of “tagging” or addressing it. Second, the nanoparticles are magnetic, which means that they obey Coulomb’s law, and can be manipulated by an external magnetic field gradient. This “action at a distance,” combined with the intrinsic penetrability of magnetic fields into human tissue, opens up many applications involving the transport and/or immobilization of magnetic nanoparticles, or of magnetically tagged biological entities. In this way, they can be made to deliver a package, such as an anticancer drug, or a cohort of radionuclide atoms, to a targeted region of the body, such as a tumour. Third, the magnetic nanoparticles can be made to resonantly respond to a time-varying magnetic field, with advantageous results related to the transfer of energy from the exciting field to the nanoparticle. For example, the particle can be made to heat up, which leads to their use as hyperthermia agents, delivering toxic amounts of thermal energy to targeted bodies such as tumours; or as chemotherapy and radiotherapy enhancement agents, where a moderate degree of tissue warming results in more effective malignant cell destruction. These, and many other potential applications, are made available in biomedicine as a result of the special physical properties of magnetic nanoparticles [250].
Bhayani et al. [251] report, for the first time, immobilization of commonly used biocompatible molecules on La1-x Sr x MnO 3 nanoparticles, namely bovine serum albumin and dextran. Such bioconjugated nanoparticles have a tremendous potential application, especially in the field of biomedicine. Daengsakul et al. [61, 62] reported the cytotoxicity of La1-x Sr x MnO 3 nanoparticles with x =0, 0.1, 0.2, 0.3, 0.4, and 0.5 evaluated with cell NIH 3T3. The result showed that the La1-x Sr x MnO 3 nanoparticles were not toxic to the cells. This will be useful for medical applications. Similar studies about the toxicity of the nanoparticles were performed by Zhang et al. for safe biomedical applications [252].
Magnetic resonance imaging (MRI) represents a powerful imaging method commonly utilized in clinical practice. The method shows excellent spatial resolution, which is very suitable not only for examination of human bodies but also for detailed anatomical studies of animal models in vivo in biological research. On the other hand, the sensitivities of other techniques, such as optical methods, single-photon emission computed tomography or positron emission tomography, are much higher. Thus, the design and synthesis of so called dual or multimodal probes is an important field. The combination of both respective approaches utilizing only one dual probe, e.g., magnetic nanoparticles tagged with fluorescent moieties, establishes a very useful method for bioimaging. Moreover, fluorescent magnetic nanoparticles are promising materials for other medical applications, where the same tool might be used either for diagnostics or for therapy, like for magnetic hyperthermia and optically driven surgery. The positioning of the magnetic cores with the external magnetic field could be used in cell micromanipulation [253,254,255]. Kačenka et al. [256] reported the potential of magnetic nanoparticles based on the La0.75 Sr0.25 MnO 3 perovskite manganite for MRI. Fluorescent magnetic nanoparticles based on a perovskite manganite La0.75 Sr0.25 MnO 3 core coated with a two-ply silica layer were synthesized and thoroughly characterized in order to prepare a novel dual MRI/fluorescence probe with enhanced colloidal and chemical stability. Viability tests show that the complete particles are suitable for biological studies.
In recent years, magnetic nanoparticles have been used in magnetic hyperthermia, referring to the introduction of ferromagnetic or super-paramagnetic particles into the tumor tissue. The magnetic nanoparticles create heat that can be used to treat cancer when they are placed in alternating magnetic fields. The La1-x Sr x MnO 3 nanoparticles for hyperthermia applications are studied in details [257,258,259,260].
Catalysts
Research in environmental catalysis has continuously evolved over the last two decades owing to the necessity of obtaining worthwhile solutions to environmental pollution problems. The development of innovative environmental catalysts is a crucial factor toward the purpose of determining new sustainable manufacturing technologies. Rare earth perovskite manganites attract notable attention of explorers due to their high catalytic activity in numerous redox reactions [261, 262].
Oxygen electrocatalysis is one of the key processes limiting the efficiency of energy conversion devices such as fuel cells, electrolysers, and metal-air batteries. In particular, the oxygen reduction reaction (ORR) is commonly associated with slow kinetics, requiring high overpotentials, and high catalyst loadings. Celorrio et al. [263] reported the effect of tellurium (Te) doping on the electrocatalytic activity of La1-x Tex MnO 3 nanoparticles with an average diameter in the range of 40 - 68 nm toward the oxygen reduction reaction.
Carbon monoxide is a colorless, odorless, and tasteless gas that is slightly lighter than air. It is toxic to humans and animals when encountered in higher concentrations. The catalytic oxidation of CO is utilized in various applications, e.g., indoor air cleaning, CO gas sensors, CO2 lasers, and automotive exhaust treatment. The structural and catalytic properties of La1-x (Sr or Bi)x MnO 3 samples with x =0.0, 0.2 or 0.4 for CO oxidation, are investigated [264].
Volatile organic compounds (VOCs), emitted from many industrial processes and transportation activities, are considered as great contributors to the atmospheric pollution and dangerous for their effect on the human health [265]. From an economical point of view, compared to an incineration process, catalytic combustion is one of the most interesting technology for the destruction of emissions of VOCs. Blasin-Aubé et al. [266] reported that the La0.8 Sr 0.2 MnO3+x perovskite-type catalyst is highly active in the oxidative destruction of VOCs, especially for oxygenated compounds.
The possibility of catalytic activity enhancement in NO reduction is also studied [267]. Ran et al. synthesized the Ce-doped PrMnO3 catalysts and investigated the effect of cerium doping on the catalytic properties of Ce-doped PrMnO3 catalysts. Their results showed that in the case of the Ce-doped series with lower doping ratio, most of the Ce 4+ ions were introduced into the A-site to form perovskite-type oxides with some additional ceria. The oxidation state of manganese was more easily affected by the addition of cerium and more vacancies might arise at the A-site due to the structural limit of the oxide. High catalytic activity in NO reduction might be caused by the presence of oxygen vacancies and the relative ease of oxygen removal. Besides, ceria could also adsorb oxygen to sustain the reduction of NO.
Solid Oxide Fuel Cells
Solid oxide fuel cells (SOFCs) have become of great interest as a potential economical, clean, and efficient means of producing electricity in a variety of commercial and industrial applications. Its major advantages include high efficiency, potential for cogeneration, modular construction, and very low pollutant emissions. Lanthanum manganite-based oxides, e.g., La1-x Ca x MnO 3 and La1-x Sr x MnO 3 , are promising materials as cathodes, because of their high electrical conductivity and good compatibility with yttria-stabilized zirconia (YSZ).
For example, nano-sized (La0.85 Sr0.15 ) 0.9 MnO 3 and Y0.15 Zr0.85 O1.92 (LSM–YSZ) composite with 100–200 nm in diameter was co-synthesized by a glycine–nitrate process (GNP) [268]. Alternating current impedance measurement revealed that the co-synthesized LSM–YSZ electrode shows lower polarization resistance and activation energy than the physically mixed LSM–YSZ electrode. This electrochemical improvement was attributed to the increase in three-phase boundary and good dispersion of LSM and YSZ phases within the composite. Lay et al. [269] synthesized the Ce-doped La/Sr chromo-manganite series (Cex La0.75- x Sr0.25 Cr0.5 Mn0.5 O 3 x で =0, 0.10, 0.25, and 0.375) as potential SOFC anode or solid oxide electrolyzer cell (SOEC) cathode materials. All those materials are stable in both elaboration and operating conditions of an SOFC anode, and they are also stable in steam electrolysis of cathodic conditions in SOEC. Besides, the possibility of A2-x A′x MO4 (A =Pr, Sm; A′ =Sr; M =Mn, Ni; x =0.3, 0.6) as a cathode of SOFC was investigated by Nie et al. [270].
Besides being used as cathodes in solid oxide fuel cells, rare earth-doped perovskite manganite oxides (Lnx A 1-x MnO 3 ) also exhibit high potential for being used as redox materials for solar thermochemical fuel production from thermochemical H2 O/CO2 splitting [271]. It was reported that substituted lanthanum manganite perovskite was one of the most suitable candidates among the perovskite family, owing to its unique redox properties [272]. To further improve the redox properties of these materials, Nair and Abanades [273] performed a systematic study to investigate the effects of synthesis methods on the redox efficiency and performance stability for CO2 splitting. They synthesized single-phase Lax Sr1-x MnO 3 (LSMO) by using various technical routes such as solid-state reactions, pechini process, glycine combustion, or glucose-assisted methods, and found that the materials synthesized by the pechini method exhibited the highest reactivity among the series, and a stable CO production of ~ 260 μmol g − 1 was achieved at x =0.5. They also found that the substitutions of Y/Ca/Ba at A-site and Al/Fe at B-site in (La,Sr)MnO3 did not enhance the redox cycling capability as compared with LSMO. It was observed that Sr was the best A-site substituent and the presence of single Mn cation alone in B site was the most suitable option for promoting CO2 -splitting activity. Furthermore, the addition of promotional agents and sintering inhibitor such as MgO and CeO2 without altering the La0.5 Sr 0.5 MnO 3 composition could improve the CO2 -splitting activity. For an overview on the recent progress on solar thermochemical splitting of water to generate hydrogen, we refer to other review articles [ 274–276].
1D Rare Earth-Doped Perovskite Manganite Oxide Nanostructures
Catalysts
In the catalytic combustion of methane, the perovskite manganites nanoparticles generally lose their activities due to the severe sintering under such a high-output and high-temperature reaction. As a consequence, designing of highly reactive and stable catalysts has been an interesting research direction in heterogeneous catalysis. Recently, some results indicate that the catalytic properties of the catalysts could be improved by controlling their morphologies and structure. For example, SrCO3 nanowires showed higher activity for ethanol oxidation than the nanoparticles [277]. Besides, CeO2 nanorods were more reactive for CO oxidation than the corresponding nanoparticles [278]. However, catalytic properties of 1D Rare earth-doped perovskite manganite have been scarcely reported. Teng [279] reported the hydrothermal synthesis of La0.5 Sr 0.5 MnO 3 nanowires, and the stability and the activity for methane combustion of La0.5 Sr 0.5 MnO 3 nanowires were also investigated. The results showed that after being calcined for a long time, the nanowires showed a higher stability as compared with the La0.5 Sr 0.5 MnO 3 ナノ粒子。 The nanowire catalyst maintained a higher catalytic activity for methane combustion. The photocatalytic activity of La1-x Ca x MnO 3 ( x ≈ 0. 3) nanowires synthesized by hydrothermal method was also investigated by Arabi et al. [230]. The results revealed that La0. 68 Ca0.32 MnO 3 nanowires exhibited sufficient photocatalytic activity for degradation of methylene blue solution under visible-light irradiation.
Solid Oxide Fuel Cells
Up to now, various approaches have been suggested to fabricate LSM/YSZ composite cathodes for SOFCs. Several researches have shown that electrode microstructure (i.e., particle size, pore size, and porosity) has a strong influence on the value of the area specific resistance (ASR) [280,281,282]. Da and Baus synthesized La0.65 Sr 0.3 MnO 3 (LSM) nanorods through a simple hydrothermal reaction. It is worth noting that the ASR values in this work are substantially lower than most of the former reports available in the literature [268, 283,284,285,286,287,288]. They pointed out that the promising performance of the nanostructured LSM cathodes was attributed to the optimized microstructure, i.e., high surface area, small grain size, and good inter-granular connectivity, which make it a potential candidate for intermediate temperature SOFC application. In addition, nano-tube structured composite cathodes were also investigated [283]. La0.8 Sr 0.2 MnO3-δ /Zr0.92 Y0.08 O 2 (LSM/YSZ) composite nano-tubes are co-synthesized by a pore wetting technique as a cathode material for SOFCs. The as-prepared nanostructured composite cathode shows low ASR values of 0.17, 0.25, 0.39, and 0.52 Ω cm −2 at 850, 800, 750, and 700 °C, which is mainly due to small grain size, homogeneous particle distribution and fine pore structure of the material.
Magnetic Memory Devices
The elaboration of submicron MR read heads and high-sensitive elements of non-volatile memories (MRAM) passes through patterning processes that are commonly used in the semiconductor industry. The planar processes for thin-film patterning are based on two main steps:(i) the pattern definition in photon or electron sensitive polymer (resist) by lithography and (ii) the transfer of these nanostructures in the manganite film using dry etching [163]. Conventional UV lithography is traditionally used to get patterns higher than one micron in size; however, patterning at dimensions lower than 50 nm needs high-resolution techniques such as scanning electron beam lithography (SEBL), X-ray lithography (XRL), or NI [289, 290]. At present, ultimate resolution limits of SEBL and XRL are well known [291, 292] and the electron PMMA (polymethylmethacrylate) resist allows replications below 20 nm. After nanolithography, the pattern transfer can be achieved using direct etching with the resist as mask, or using a metallic lift-off process followed by etching. The lift-off process is the preferred method for manganite etching since these CMR oxides are very hard materials compared to metals.
A magnetic domain wall separates two oppositely polarized magnetic regions, and a number of data storage schemes based on domain walls in magnetic nanowires have been proposed [293, 294]. In the race-track memory, each magnetic domain wall represents a data bit [293]. During the write operation, the domain wall is moved by external magnetic field or spin transfer torque [295,296,297]. To read a bit, GMR or TMR type devices are used to detect the stray field from the domain wall. To utilize such a scheme, it is critical to controllably create domain walls. Magnetic nanowires with an artificial pinning center, such as notches [293], bent conduits [298], and narrow rings [299], can serve this purpose. In perovskite manganite nanostructures, various types of domain patterns such as stripes [300], bubbles [301], and checker-boards [302] have been reported. For example, Wu et al. [303] reported on the perpendicular stripe magnetic domains in La0.7 Sr 0.3 MnO 3 nanodots. Takamura et al. [304] reported flower-shaped, flux closure domain, and vortex structures in patterned manganites created by Ar+ ion milling. Mathews et al. [305] reported successful fabrication of La0.67 Sr 0.33 MnO 3 nanowires on NdGaO3 substrate by using interference lithography. It was demonstrated that not only the shape anisotropy but also the substrate induced anisotropy play important roles in determining the magnetic easy axis in these manganite nanostructures. In spite of challenges in controlling magnetic domain walls in perovskite manganite oxide nanowires, several groups have reported current induced domain wall motion in perovskite manganite oxide materials such as La0.7 Sr 0.3 MnO 3 and La0.67 Ba0.33 MnO3-δ 。 By using FIB milling, Ruotolo et al. [306] and Céspedes et al. [139] patterned La0.7 Sr 0.3 MnO 3 into nanowires containing notches as the domain wall pinning centers. The MR measurements confirm the current induced domain wall depinning with a critical current density of 10 11 A/m 2 。 Liu etal。 [307] reported current dependent low-field MR effect in La0.67 Sr 0.33 MnO 3 nanowires with constrictions and they ascribed this effect to the spin polarized bias current. In a similar constricted La0.67 Ba0.33 MnO3-δ nanowire, Pallecchi et al. [308] observed magnetic field and DC bias current dependent asymmetric resistance hysteresis, which was also connected to the effect spin transfer torque. Surprisingly, the threshold current was found to be in the range of 10 7 –10 8 A/m 2 , much smaller than the typical current (10 11 A/m 2 ) needed for moving domain walls in metals [309]. A number of possibilities, such as stronger spin torque due to half metallicity, Joule heating assistance, and spin wave excitation, may contribute to such a drastic reduction in the threshold current.
Spintronic Devices
In terms of perovskite manganites, the large MR and the great tunability of CMR oxides are promising for magnetic recording, spin valve devices, and magnetic tunnelling junctions [310,311,312,313,314]. However, there are several obstacles related to perovskite manganites in nanodevice applications. First, the spin polarization of manganites decays rapidly with temperature. Second, the defect chemistry and the stoichiometry–property correlation in perovskite manganites are quite complex [315, 316]. Third, the physical properties of interfaces in manganite-based devices remain elusive [317, 318]. Finally, there is the urgent need for developing suitable device processing techniques.
The spintronic devices exhibit prominent advantages, such as nonvolatility, increased processing speed, increased integration densities, and reduced power consumption. The significance and value of spintronics lies in the study of active control of carrier spin, and then the development of new devices and technologies, for example, spin transistors, spin-FET, spin-LED, spin-RTD, spin filters, spin modulators, reprogramming gate circuit.
Nanowires have been successfully incorporated into nanoelectronics [319], and naturally they are envisaged as ideal building blocks for nanoscale spintronics. For perovskite manganite oxides, nanowires and related heterostructures hopefully can enhance the Curie temperature [82] and the low-field MR [75, 320]. Another promising research topic is anisotropic magnetoresistance (AMR) which is a result of spin-orbital interaction and has important applications in magnetic field detection and data storage [321]. Significant magnetic anisotropy has been observed in perovskite manganite oxide nanowires [322]. In addition, the morphology of nanowire can be modified by annealing or growing on engineered substrates [323], which could significantly affect their properties. It is expected that more efforts will be made to explore the anisotropic transport properties of perovskite manganite oxide nanowires and to gain deeper understanding of low-dimensional spin-dependent transport properties.
Spin valves based on perovskite manganite oxide nanowires are also reported. Gaucher et al. [324] successfully fabricated La2/3 Sr1/3 MnO 3 nanowires with the smallest width of 65 nm by combining electron beam lithography and ion beam etching. They showed that the electronic transport properties of these perovskite manganite oxide nanowires are comparable to those of unpatterned films.
2D Rare Earth-Doped Perovskite Manganite Oxide Nanostructures
Magnetic Memory Devices
Typically, micrometer-sized La0. 7 Sr 0 。 3 MnO 3 dots with smooth edge and surface are etched in the corresponding films by such lift-off process. Ruzmetov et al. [135] fabricated regular arrays of epitaxial perovskite La2/3 Sr1/3 MnO 3 magnetic nanodots by PLD combined with electron beam lithography and argon ions exposure. The diameters of these dots are less than 100 nm with a height about 37 nm. These perovskite magnetic nanodots maintain their crystallinity, epitaxial structure, and ferromagnetic properties after the fabrication process, which have promising applications in magnetic massive memory devices.
Liu etal。 [325] demonstrated a new programmable metallization cell based on amorphous La0.79 Sr0.21 MnO 3 thin films for nonvolatile memory applications. The schematic diagram of the metallization cell is shown in Fig. 41, where amorphous La0.79 Sr0.21 MnO 3 thin films are deposited on the Pt/Ti/SiO2 /Si substrates by rf magnetron sputtering. The Ag/amorphous La0.79 Sr0.21 MnO 3 /Pt cell exhibited reversible bipolar resistive with a ROFF /RON ratio (> 10 2 ), stable write/erase endurance (> 10 2 cycles) with resistance ratio over 10 2 , and stable retention for over 10 4 s。 Such a sandwiched device may be a promising candidate for future nonvolatile memory applications.

Schematic of the Ag/La0.79 Sr0.21 MnO 3 ( a -LSMO)/Pt memory device. Reproduced with permission of [325]
Hoffman et al. [326] also tested the non-volatile memories using an electric-field-induced M–I transition in the PbZr0.2 Ti0.8 O 3 /La1-x Sr x MnO 3 (PZT/LSMO), PZT/La1-x Ca x MnO 3 (PZT/LCMO), and PZT/La1-x Sr x CoO3 (PZT/LSCO) devices. To study the switching speed of the Mott transition field effect devices, they fabricated a series of devices where the room temperature RC-time constants varied from 80 ns to 20 μs. They found the circuit RC- time constant limited the switching speed of devices down to 80 ns, offering the opportunity for faster operation though device scaling. Room temperature retention characteristics show a slow relaxation, with more than 75% of the initial polarization maintained after 21 days. These Mott transition field effect devices have promising potential for future non-volatile memory applications.
Spintronic Devices
Spin valves may be the most influential spintronic devices which have already found applications in magnetic data storage industry. Its basic working principle is the GMR effect [327, 328], where the resistance of a FM/NM (non-magnetic)/FM multilayers depends on the relative alignment between the two FM layers. Most GMR research focuses on transition metals, but spin valves have also been realized in oxides, in particular FM manganites [329, 330]. A related concept is the magnetic tunnel junction (MTJ) [331, 332], which also has vast applications in nonvolatile magnetic memory devices. The basic difference between spin valve and MTJ lies in the middle spacer layer, which needs to be insulating for MTJ, whereas for spin valve, this layer is conducting. A number of efforts have been devoted to create oxide based MTJ devices so far, especially due to the 100% spin polarization in several FM oxides, such as La1-x Sr x MnO 3 x で ~ 0.33, CrO2 およびFe 3 O 4 。 Lu etal。 [333] and Sun et al. [334] first fabricated all-oxide MTJ device with La0.67 Sr 0.33 MnO 3 およびSrTiO 3 as FM and insulating layer, respectively. Subsequently, a record tunneling magnetoresistance (TMR) ratio of 1850% was reported in 2003 by Bowen et al. [335]. Despite these promising results, a major issue for the oxide based MTJ devices is that the working temperature is often lower than the room temperature, generally ascribed to the degraded interfaces [336, 337].
Magnetic Sensors
The application of perovskite manganite CMR thin films to magnetic sensors at room temperature has been considered. Compared to magnetoresistive sensors using permalloy films, the field coefficient of resistance (dR/dH)/R is much smaller, typically of about (10 −2 –10 −1 )% per mT. However, they can operate over a wide field range and their characteristics should be maintained at submicron lateral size, since the CMR mechanism does not involve large scale entities such as magnetic domains and walls. By means of magnetic flux concentration with soft ferrite poles, the field coefficient of resistance can be increased up to 4% per mT [338]. Other applications of CMR of La0.67 Sr 0.33 MnO 3 thin films to position sensors and to contact-less potentiometers are presently investigated [339]. The basic idea is to exploit the large resistance variation induced by the stray field of a permanent magnet in Sm-Co or Nd-Fe-B alloys.
In recent years, there has been growing demand for sensitive yet inexpensive infrared detectors for use in a variety of civilian, industrial, and defense applications such as thermal imaging, security systems and surveillance, night vision, biomedical imaging, fire detection, and environmental detection. The material for bolometric applications should possess a high temperature coefficient of resistivity (TCR), which enables small temperature variations caused by absorbed infrared radiation (IR) generate a significant voltage drop across the bolometer. High TCR in recently discovered CMR manganese oxides in the vicinity of metal-to-semiconductor phase transition makes them suitable for thermometer and bolometer applications. For example, Lisauskas et al. [340] reported that the epitaxial submicron thick perovskite manganite La0.7 (Pb0.63 Sr0.37 )0.3 MnO 3 films deposited on LAO single crystal by PLD exhibited high value of TCR (=7.4% K −1 @ 295 K). Choudhary et al. [341] synthesized the polycrystalline/amorphous films with mixed-valence manganites (e.g., La0.7 Ca 0.3 MnO 3 、La 0.5 Sr 0.5 MnO 3 、La 0.5 Ba 0.5 MnO 3 , and (La0.6 Pr0.4 )0.67 Ca 0.33 MnO 3 ) by PLD at low temperature (450 °C) on single crystal (001) silicon substrate. These films are evaluated for uncooled bolometric applications.
Solid Oxide Fuel Cells
Lussier et al. [342] identified a mechanism whereby the strain at an interface is accommodated by modifying the chemical structure of the SOFC material to improve the lattice mismatch and distribute the strain energy over a larger volume (thickness), concentrate on two particular manganite compounds, La2/3 Ca 1/3 MnO 3 and La1/2 Sr 1/2 MnO 3 thin films.
3D Rare Earth-Doped Perovskite Manganite Oxide Nanostructures
Recently, several 3D rare earth-doped perovskite manganite oxide nanostructures such as 3D (La0.275 Pr0.35 Ca0.375 )MnO3 nanobox array structures (145), 3D strained LSMO–CeO2 VAN nanostructures (198) fabricated by PLD technique are reported. It was found that 3D (La0.275 Pr0.35 Ca0.375 )MnO3 nanobox array structures exhibited an insulator-metal transition at higher temperature than that in the corresponding thin film, which provided a new way to tune the physical properties of CMR oxide 3D nanostructures. This enables 3D (La0.275 Pr0.35 Ca0.375 )MnO3 nanobox array structures to find promising application in oxide nanoelectronics by making full use of the huge electronic/spintronic phase transition. The 3D framework of LSMO–CeO2 VAN nanostructures combine not only the lateral strains from the layered structures but also the vertical strain from the VAN, and thus maximize the 3D strain states in the systems, controlling the electron transport paths. This new 3D framed design provides a novel approach in maximizing film strain, enhancing strain-driven functionalities, and manipulating the electrical transport properties effectively. At present, the applications of 3D rare earth-doped perovskite manganite oxide nanostructures in the fields of oxide nanoelectronics, spintronics, and solar energy conversion are still in their infancy; thus, many problems remain unsolved and technical challenges lie ahead. In this direction, there is a long way to walk on before the commercialization of rare earth-doped perovskite manganite oxide nanostructures.
Conclusions and Perspectives
In this work, we have discussed the recent advances in the fabrication, structural characterization, physical properties, and functional applications of rare earth-doped perovskite manganite oxide nanostructures. It is our aim that we have captured all the excitements achieved in the development of rare earth-doped perovskite manganite oxide nanostructures used for microelectronic, magnetic, and spintronic nanodevices, providing some useful guidelines for the future researches. In spite of great progress made in the past two decades, considerable effort is highly required to realize the practical applications of rare earth-doped perovskite manganite oxide nanostructures in the next generation of oxide nanoelectronics. While many fascinating physical properties of rare earth-doped perovskite manganite oxide nanostructures are originated from the interactions among the spin, charge, orbital, and lattice degrees of freedom, whereas there is still a long way to go for obtaining a full understanding of the interaction mechanisms among the spin, charge, orbital, and lattice degrees of freedom. It is expected that in the next years, further progress will be achieved in the experimental and theoretical investigations on rare earth-doped perovskite manganite oxide nanostructures. We believe that this review of the recent advances on rare earth-doped perovskite manganite oxide nanostructures will motivate their future researches and applications of not only in the fields of oxide nanoelectronics, but also in energy and biomedical fields.
データと資料の可用性
It is a review article that gives a comprehensive overview of the recent progress in the fabrication, structural characterization, physical properties, and functional applications of rare earth-doped perovskite manganite oxide nanostructures.
略語
- 0D:
-
Zero-dimensional
- 1D:
-
一次元
- 2D:
-
二次元
- AAO:
-
Anodic aluminium oxide
- AFM:
-
反強磁性
- AFM:
-
原子間力顕微鏡
- CMR:
-
Colossal magnetoresistance
- CSD:
-
Chemical solution deposition
- CTAB:
-
Cetyltrimethylammonium bromide
- CVD:
-
化学蒸着
- EDS:
-
Energy Dispersive X-ray spectroscopy
- EELS:
-
Electronic energy loss spectroscopy
- EPS:
-
Electronic phase separation
- FC:
-
Field cooling
- FE-SEM:
-
電界放出型走査電子顕微鏡
- FIB:
-
Focus ion beam
- FM:
-
強磁性
- FTIR:
-
フーリエ変換赤外分光法
- HRTEM:
-
高分解能TEM
- LAO:
-
LaAlO3
- LCMO:
-
La1-x Ca x MnO 3
- LPCMO:
-
(La5/8-0.3 Pr0.3 )Ca3/8 MnO 3
- LSMO:
-
La0.7 Sr 0.3 MnO 3
- MBE:
-
分子線エピタキシー
- MCE:
-
Magnetocaloric effect
- M-H:
-
Microwave-hydrothermal
- M–I:
-
Metal-insulator
- MOCVD:
-
Metalorganic chemical vapor deposition
- MR:
-
Magnetoresistance
- MRI:
-
磁気共鳴画像法
- MSS:
-
Molten salt synthesis
- MTJ:
-
Magnetic tunneling junctions
- NGO:
-
NdGaO3
- PLD:
-
パルスレーザー堆積
- PMMA:
-
ポリメチルメタクリレート
- PVD:
-
Physical vapor deposition
- RCP:
-
Relative cooling power
- SAED:
-
選択領域電子回折
- SEBL:
-
Scanning electron beam lithography
- SG:
-
Spin glass
- SOFCs:
-
Solid oxide fuel cells
- SPM:
-
Super-paramagnetic
- STEM:
-
走査型透過電子顕微鏡法
- STO:
-
SrTiO 3
- TCR:
-
Temperature coefficient of resistivity
- TEM:
-
透過型電子顕微鏡
- UHV:
-
Ultra-high vacuum
- VOCs:
-
Volatile organic compounds
- XPS:
-
X-Ray photoelectron spectroscopy
- XRD:
-
X線回折
- XRL:
-
X-ray lithography
- YSZ:
-
Yttria-stabilized zirconia
- ZFC:
-
Zero-field cooling
ナノマテリアル
- ナノバイオテクノロジーによる早期の病気の検出の加速
- 3D-DNAナノ構造
- 癌治療のためのナノ粒子:現在の進歩と課題
- エネルギー貯蔵への応用のための酸化鉄ベースのナノ構造の進歩
- 高効率ペロブスカイト太陽電池に関する短い進捗報告
- invitroおよびinvivoでのグラフェンおよび酸化グラフェンのバイオセーフティおよび抗菌能力
- 薄膜トランジスタ用の酸化インジウムナノフィルムの原子層堆積
- 紫外線支援酸化銅ナノワイヤー水素ガスセンサー
- ナノ粒子関連治療の新しい道
- ゾルゲル法で合成されたPrドープペロブスカイトマンガン酸塩La0.67Ca0.33MnO3ナノ粒子の微細構造、磁気、および光学特性
- 形状選択的な細胞取り込みのための成長する金ナノ構造